
859 active US unicorns carried a combined private valuation of $4.34 trillion at the end of 2025. Yet only 49 venture-backed companies completed IPOs during the year, and 67% of unicorn IPOs were priced below their final private-market valuation. The gap between private valuations and public exit prices shows why a successful listing does not automatically produce a strong return for a late-stage secondary buyer.
A company may have fast revenue growth, respected investors, and a credible path to an IPO. However, those qualities do not reveal the probability of losing capital, achieving a flat exit, or earning a rare multi-bagger return.
Historical base rates offer a more disciplined starting point. They compare losses, moderate outcomes, and exceptional wins across available venture and secondary-market data. Nevertheless, the evidence must be handled carefully because failed, distressed, and inactive companies are often less visible than successful issuers.
The central question is therefore not whether pre-IPO investments can produce large gains. It is how often each outcome occurs and whether the proposed entry price adequately compensates the buyer for illiquidity, dilution, share-class risk, and the possibility of a delayed or disappointing exit.
Why Base Rates Matter More Than Headline Valuations
A base rate measures how frequently an outcome occurred within a defined group. For pre-IPO underwriting, that group might include US venture-backed companies purchased after Series C, through a secondary transaction, during a specific market cycle.
This reference class gives the buyer a starting probability. Company growth, margins, leadership, sector strength, and IPO readiness can then improve or weaken that starting point.
Without a base rate, analysts can fall into the base-rate fallacy. They give more weight to an attractive company story than to the historical performance of comparable investments.
The danger is visible in the current market. PitchBook data published by the National Venture Capital Association counted 859 active US unicorns at the end of 2025, carrying an aggregate valuation of $4.34 trillion. Yet only 49 VC-backed companies completed IPOs during the year. Moreover, 67% of unicorn IPOs were priced below their final private-market valuation.
A down IPO does not automatically create a loss for every investor. An early shareholder may still earn a strong return. However, a secondary buyer who entered near the last private valuation has a much narrower margin of safety.
What Available Data Can Actually Measure
No public database follows every secondary purchase from trade date to final cash proceeds. Consequently, a credible analysis must combine several sources.
Marketplace data from Forge can show bids, asks, completed trades, discounts, premiums, and changes in investor demand. PitchBook and public company records can identify funding rounds, acquisitions, shutdowns, and IPOs. SEC registration statements can then help reconcile share counts, offering prices, dilution, and preferred-stock conversion.
Even after matching these records, the calculation must use the investor’s effective cost rather than the company’s headline valuation.
Net multiple on invested capital equals net proceeds divided by total investor cost.
Total cost may include the purchase price, transaction charges, special-purpose vehicle expenses, management fees, carried interest, and transfer costs. Meanwhile, proceeds must reflect dilution, liquidation preferences, and the actual security owned.
Share class is particularly important. Research by Will Gornall and Ilya Strebulaev examined 135 US unicorns and found that reported post-money valuations averaged 48% above estimated fair value after contractual rights were considered. Common shares were estimated to be 56% overvalued, while 65 of the 135 companies lost unicorn status under the adjusted valuation method.
This does not mean every common share trades at a 56% discount. Instead, it shows why applying the latest preferred-share price to every share can exaggerate the value available to a secondary buyer.
Historical Outcome Distribution From Available Evidence
The most complete publicly discussed outcome evidence comes from broad US venture financing datasets rather than a secondary-market-only registry. Therefore, these figures should be treated as starting benchmarks, not direct probabilities for every late-stage transaction.
A widely cited Correlation Ventures analysis covered 21,640 US venture financings completed between 2004 and 2013. Its financing-level distribution placed approximately 65% of outcomes below 1x invested capital, 25% between 1x and 5x, 6% between 5x and 10x, and 4% at 10x or higher.
Correlation Ventures later updated its analysis using US venture-funded companies that exited during the decade ending in 2022. In the updated dollar-weighted results, 37% of invested capital generated less than 1x, while less than 4% produced returns of 10x or more. Nearly half of individual financings lost money.
Realized outcome | Historical financing-level share | Updated evidence | Meaning for a secondary buyer |
Loss below 1x | About 65% | 37% of invested capital and nearly half of the financings | Loss scenarios must receive a meaningful probability |
Return from 1x to below 5x | About 25% | Not separately disclosed | A positive exit may still provide a weak annualized return |
Return from 5x to below 10x | About 6% | Not separately disclosed | Strong result, but uncommon across the full sample |
Return of 10x or more | About 4% | Less than 4% of invested capital | Treat as an outlier, not the central forecast |
Unresolved investment | Excluded from realized outcomes | Excluded until an exit occurs | Retain separately rather than assuming success or failure |
The historical 5x-to-10x share is derived from the reported 10% of financings returning more than 5x and the 4% returning at least 10x.
These figures reveal two different views. Financing-level results show how frequently individual investments fall into each bracket. Dollar-weighted results show where invested capital ultimately lands. Large successful rounds can improve the dollar-weighted distribution even when many individual financings lose money.
Late-stage losses can also be severe. AngelList analysed more than 20,000 platform investments and reported that the average money-losing late-stage investment lost nearly 60% of its value. The same research found that late-stage venture behaved more like public equity than early-stage venture, but it remained more volatile than many buyers expected.
Holding time changes the meaning of every positive outcome. A 2x return over three years equals an annualized return of roughly 26%. The same 2x return over ten years falls to about 7.2% annually before taxes, fees, and the cost of illiquidity.
Survivorship Bias and the Losses That Disappear
Pre-IPO secondary market historical base rates can look better than reality when failed and inactive companies are missing.
Successful companies continue attracting bids, generating media coverage, and producing public filings. Distressed issuers often trade less frequently. Some disappear from active marketplaces before their bankruptcy, restructuring, or dissolution is fully recorded.
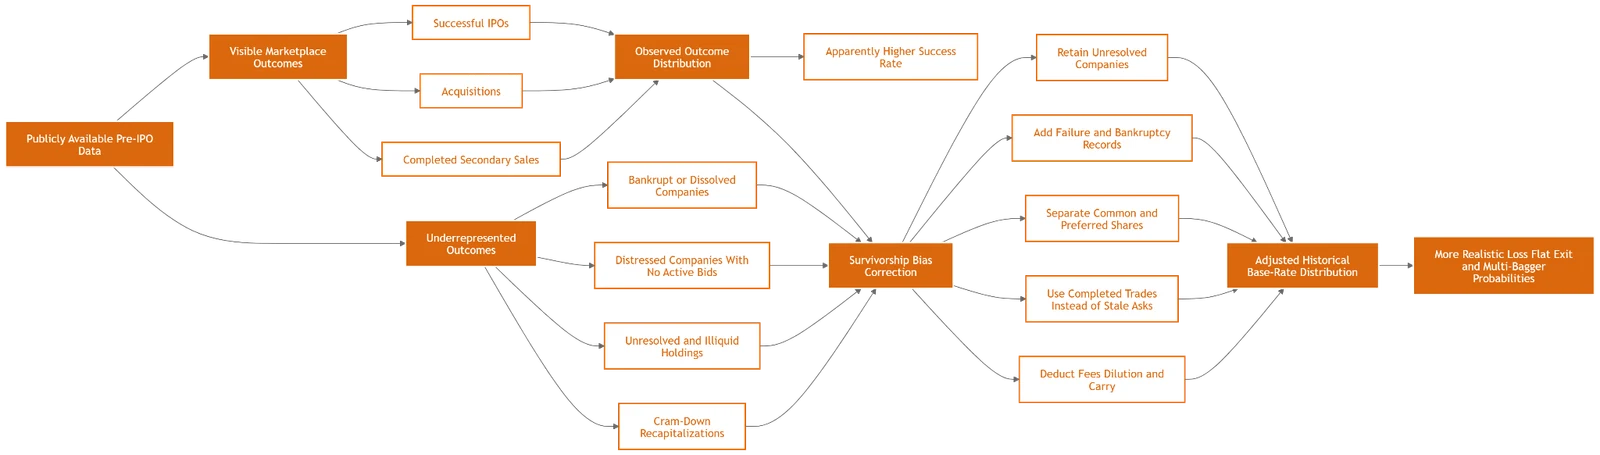
Figure 2. How missing failures, inactive issuers, and unresolved holdings create survivorship bias in pre-IPO outcome data and alter the adjusted base-rate distribution.
As a result, a database built only from completed IPOs and acquisitions will naturally overstate private market exit success probability. It has already removed companies that remain trapped, inactive, or impaired.
Current marketplace data also reflects selection. In March 2026, Forge reported a median trade discount of 3% to the latest funding round. However, the 10th percentile traded at a 47% discount, while the 90th percentile reached a 64% premium. This wide range shows that a single median cannot describe the whole secondary market return distribution.
The reference class must also control for sector concentration. In 2025, AI companies represented 65.4% of US venture deal value, while the five largest companies raised almost $60 billion collectively. Therefore, a recent dataset can be heavily influenced by a small group of highly valued AI businesses rather than the broader market.
A May 2026 preprint reached a related conclusion. It found that venture outcomes remained dominated by extreme winners and that downside findings changed depending on how zero-value outcomes were treated. Because the paper is preliminary and has not completed peer review, it should support further testing rather than serve as a final historical rule.
A defensible dataset should retain unresolved companies as censored observations. In simple terms, their final outcome is unknown because a liquidity event has not happened. Removing them would make the sample cleaner but less representative.
Turning Base Rates Into a Pre-IPO Secondary Decision
Historical base rates should lead to a price decision, not merely a risk warning.
First, assign a probability to each outcome bracket using the closest available reference class. Next, estimate the net return within each bracket after fees, dilution, share rights, and holding time.
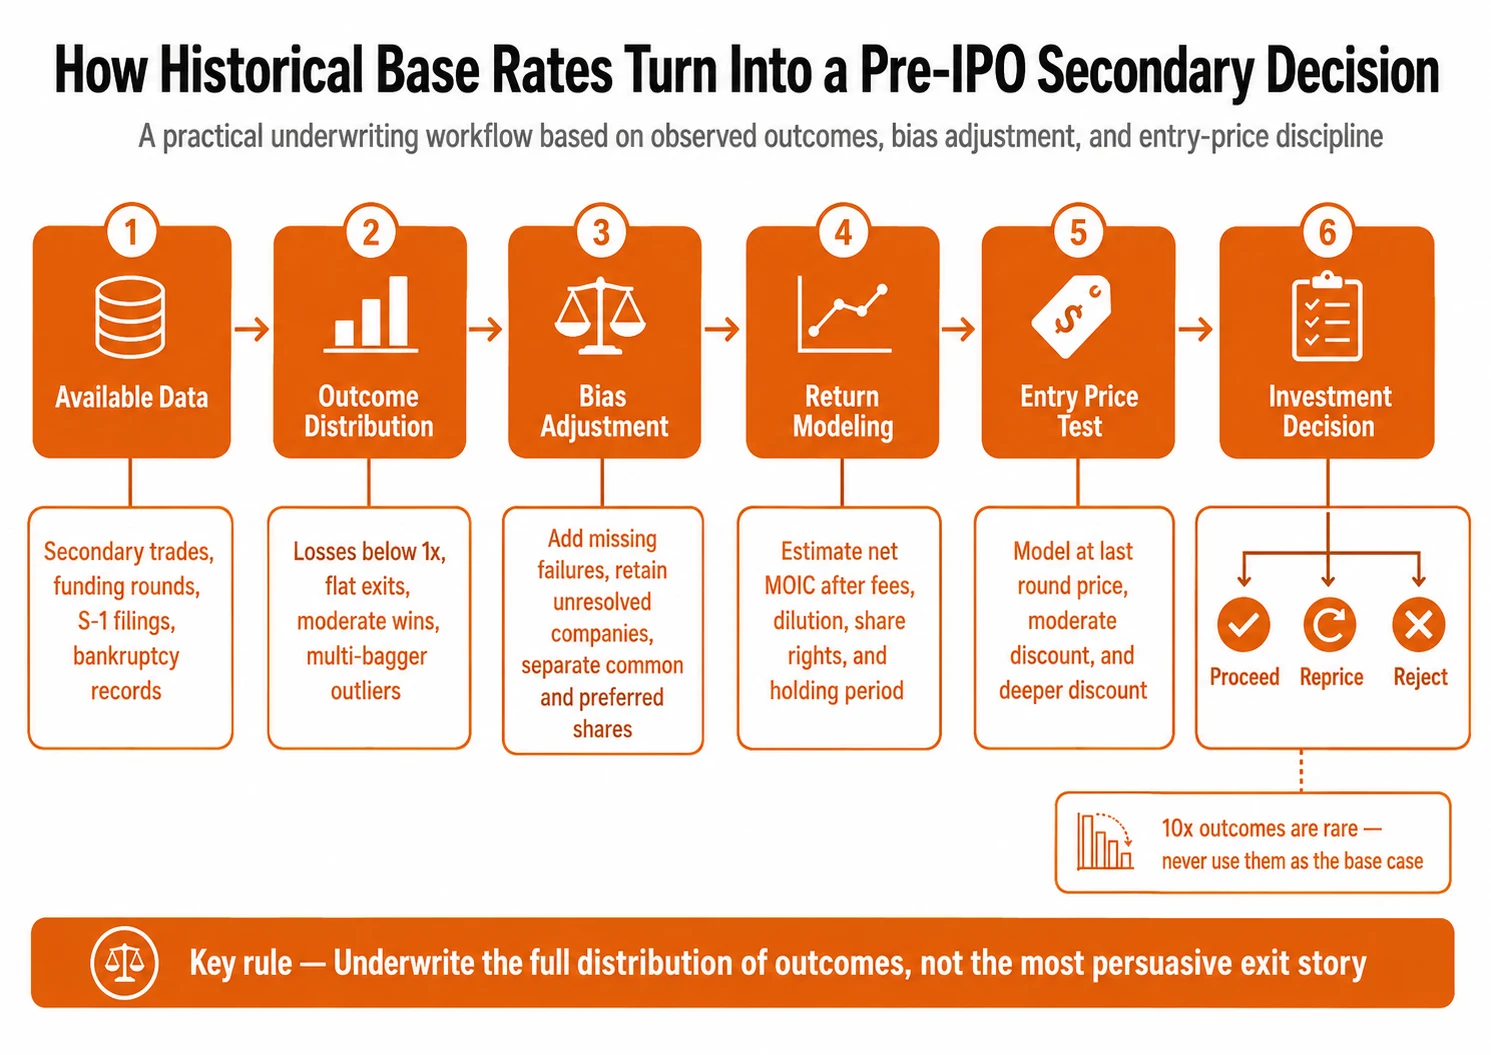
Figure 1. Historical base-rate underwriting workflow for converting available pre-IPO market data into bias-adjusted return estimates, entry-price tests, and proceed, reprice, or reject decisions.
Expected MOIC equals the sum of each outcome probability multiplied by its estimated net MOIC.
The result should then be tested at three entry prices:
- The latest preferred-round price
- A moderate secondary discount
- A deeper discount required by limited liquidity or junior share rights
A buyer should reprice the investment when the expected return does not compensate for the holding period. The position should also be reduced when the most expected value comes from a 10x outcome.
For example, a deal may appear attractive because the upside scenario produces 12x. However, if that outcome carries a 4% probability and the remaining scenarios produce weak or negative returns, the investment is dependent on a rare event rather than a durable base case.
A practical decision rule is straightforward.
- Proceed when the expected net return remains attractive after a delayed exit, additional dilution, fees, and a realistic downside recovery.
- Reprice when the company remains attractive but the proposed secondary price offers insufficient protection.
- Reject when the expected return depends mainly on an outlier exit, the share rights cannot be verified, or unresolved comparable companies dominate the dataset.
Historical outcomes cannot determine what one company will do. Nevertheless, they can reveal when a valuation assumes that a rare result is normal. The strongest underwriting process starts with observed losses, flat exits, and multi-bagger frequencies. It then adjusts those probabilities for company quality, purchase price, share class, and liquidity.
FAQs
What is the historical loss rate for pre-IPO investments?
No universal pre-IPO loss rate exists. Broad venture evidence places financing-level losses below 1x between roughly half and two-thirds of realised investments, depending on the sample, period, and weighting method. Secondary buyers must then adjust that benchmark for stage, entry price, share class, and fees.
How common is a 10x pre-IPO return?
Available US venture outcome studies place 10x results at approximately 4% or less of financings or invested capital. These outcomes drive a large share of total gains, but they should remain an upside scenario rather than the expected result.
Why can a successful exit still produce a weak return?
The company may exit above the buyer’s purchase price but take many years to do so. Fees, dilution, preferred claims, and taxes can reduce the final proceeds further. Therefore, buyers should review both MOIC and annualized return.
How should unresolved private companies be treated?
They should remain in the dataset as censored observations. They should not be labelled as successful, failed, or removed simply because a final liquidity event has not occurred.
Disclaimer: This article is provided for educational purposes and does not constitute financial, investment, tax, or legal advice. Private securities can involve substantial loss, limited information, transfer restrictions, and prolonged illiquidity.