How do you audit a token's supply, vesting, and concentration metrics yourself without relying on the project's marketing page? That's the real question behind most tokenomics research, and most of the time the honest answer is: pull three sets of numbers, check them against primary sources, and score what you find.
This article is one piece of the broader risk-scoring framework used to evaluate crypto and private-market platforms before allocating capital. Tokenomics forensics is the supply-side layer of that framework. It answers a narrower, more mechanical question than "Is this a good project": how much of the token exists, when does the rest arrive, and who holds it right now.
We'll build a rubric across three metrics: circulating supply versus fully diluted valuation (FDV), vesting cliff structure, and top-holder concentration. Each section shows exactly where to pull the number from and how to score it.
Metric One, Circulating Supply vs Fully Diluted Valuation
The gap between a token's market cap and its FDV is one of the simplest, most overlooked dilution signals available. The headline ratio is quick to calculate, but validating the underlying supply figures requires deeper wallet and contract analysis
Circulating supply is an estimated measure of tokens considered available to the market under a data provider’s methodology. It is not always identical to the number of technically transferable tokens. Fully diluted valuation (FDV) is generally calculated by multiplying the current token price by the maximum supply or another fully diluted supply estimate used by the data provider. It provides a static comparison assuming price remains unchanged as supply enters circulation, rather than a future valuation forecast
The methodology CoinGecko uses to calculate circulating supply is a useful reference point for auditing any token yourself. Their own supply methodology documentation defines circulating supply as total supply minus what they call uncirculated wallets, which explicitly excludes tokens that are locked, vested, or held by the project team or foundation, even if those tokens are technically unlocked and could move at any time.
This distinction matters because a token can show a large circulating supply number while a huge portion of that supply is actually parked in a foundation treasury wallet with no real trading behavior behind it.
A data aggregator’s circulating-supply number is a derived estimate based partly on project disclosures and methodology choices, not pure raw blockchain truth. A complete audit separates raw on-chain total supply, provider-estimated circulating supply, project-reported allocations, verified vesting contract balances, and wallet-level transfers.
Where to check it: use the chain explorer, such as the Etherscan token tracker page, to verify contract-reported total supply and wallet balances, then compare those figures with aggregator estimates of circulating supply and FDV.
Scoring the gap:
Note: The scoring bands below are analytical heuristics designed for comparative screening. They are not universal risk thresholds and should be adjusted for the token’s sector, liquidity, age, emission model, and holder structure.
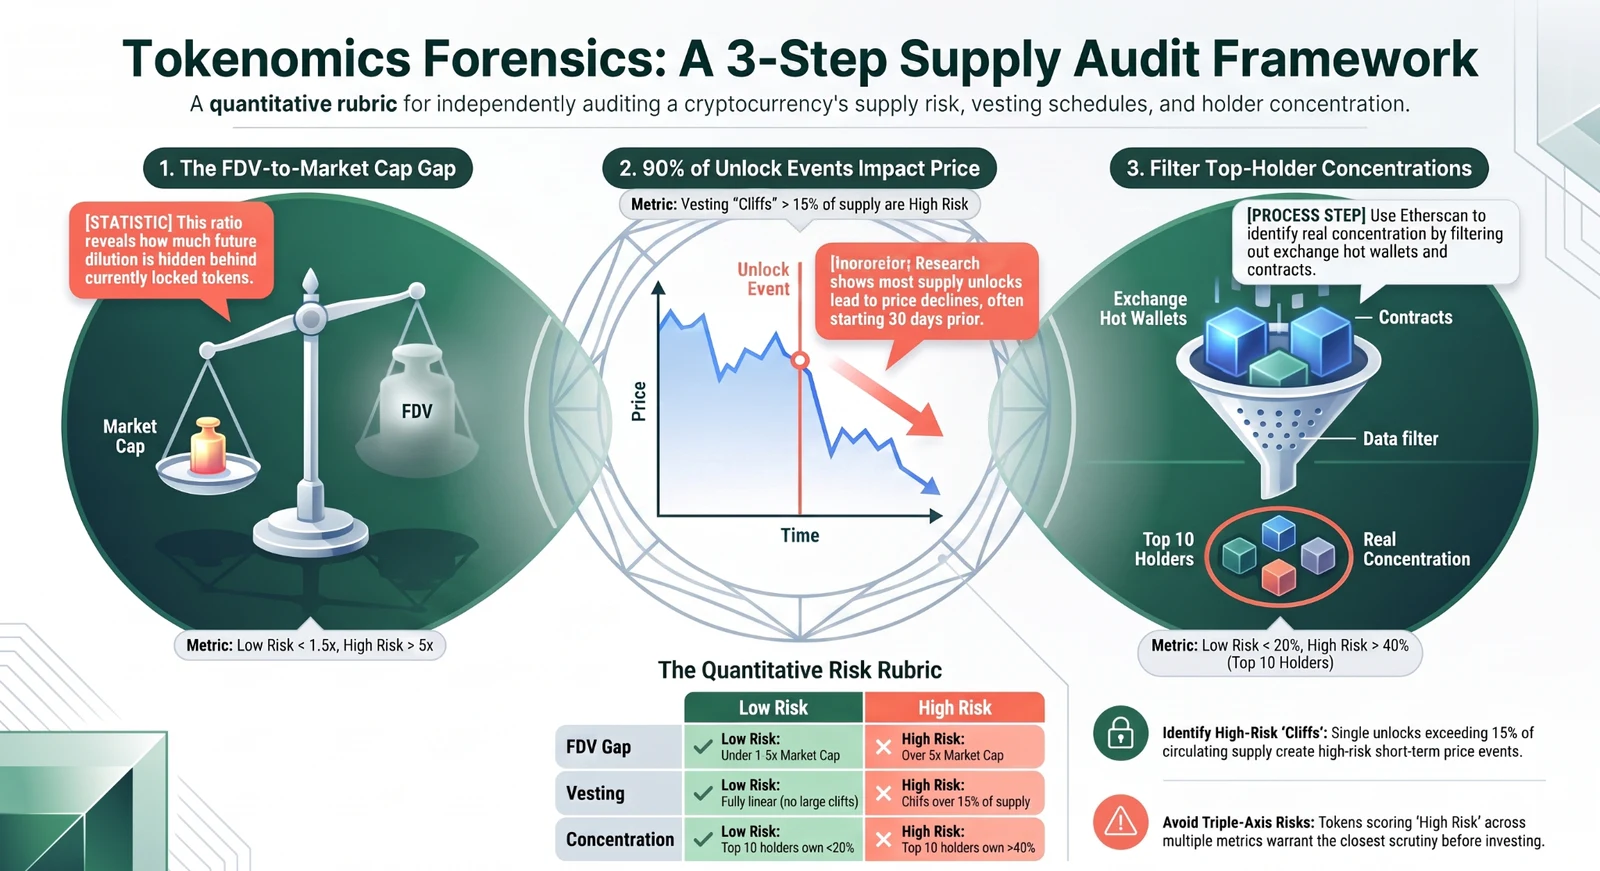
- FDV within 1.5x of market cap: low dilution risk, most of the supply is already in circulation
- FDV between 1.5x and 5x market cap: moderate risk, meaningful future dilution ahead.
- FDV above 5x market cap: high risk, the current price reflects only a small fraction of eventual supply
To refine this score, also evaluate secondary factors: supply percentage unlocking within 30 and 90 days, annualized emissions, unlock value relative to average daily trading volume, insider share of future unlocks, and contractual lockup enforceability.
Metric Two, Vesting Cliff Structure
A vesting cliff is a date on which a large block of previously locked tokens becomes tradable all at once, as opposed to linear vesting, where tokens unlock gradually over time in small increments.
The reason cliffs deserve their own scoring category, separate from the general FDV gap, is that the research on their price impact is now fairly conclusive. Keyrock's analysis of over 16,000 token unlock events found negative price behavior around a large share of observed unlock events, although the magnitude varied by unlock size, recipient category, liquidity, and market conditions. Unlocking makes tokens eligible for transfer rather than guaranteeing immediate market selling, as recipients may hold, stake, or transfer tokens off-market.
Their research also found that the price impact typically begins showing up around 30 days before the unlock date itself, as the market anticipates the incoming supply rather than waiting for it to actually hit.
A concrete example from that dataset: when Yuga Labs' APE token began a team unlock, releasing 0.7% of total supply each month, the same Keyrock analysis found the token dropped 77% over the following seven months, a decline far steeper than the roughly 9% drop in Ethereum over the same period. The relative underperformance is consistent with unlock-related selling pressure, although it does not by itself prove that vesting was the sole cause.
Cliffs and linear vesting produce meaningfully different risk profiles. A large one-time cliff concentrates the same total supply shock into a single date, creating a sharp, short-term price event. Linear vesting reduces single-date supply shocks but may still create persistent, structural selling pressure depending on recipient behavior and market liquidity. Two tokens can have the same total supply and the same unlock timeline in aggregate and still carry very different near-term risk, depending entirely on whether that supply arrives as a single cliff or a slow drip.
Evaluating cliff severity requires looking beyond the percentage of circulating supply by calculating the Unlock Pressure Ratio:

$\text{Unlock Pressure Ratio} = \frac{\text{Dollar Value of Unlock}}{\text{Average Daily Spot Volume}}$
Comparing unlock sizes directly against daily volume, order-book depth, and actual free float reveals liquidity risks that percentages of circulating supply miss.
Where to check it: the project's tokenomics page or funding round disclosures should list vesting schedules by allocation category, team, investors, ecosystem, and so on. Cross-reference the stated schedule against actual on-chain unlock events for tokens already trading, since some projects alter emission schedules after launch without prominent disclosure.
Scoring the cliff structure:
- Fully linear vesting, no single unlock exceeding 5% of circulating supply: low risk
- Mixed structure, moderate cliffs between 5% and 15% of circulating supply: moderate risk
- Large cliffs exceeding 15% of circulating supply in a single unlock, especially concentrated in team or investor allocations: high risk
An unlock event happening within the next 30 days for a token you're evaluating should be treated as an active, checkable risk factor, not a footnote. This is exactly the kind of variable that separates a scoring rubric from a gut-feeling assessment.
Metric Three, Top-Holder Concentration
The third leg of tokenomics forensics is checking who actually holds the supply right now, independent of vesting schedules or dilution math.
This is the most direct, most checkable metric of the three, because it doesn't require trusting a whitepaper at all. For supported ERC-20 tokens, explorer holder pages provide address-level balances that serve as a starting point for concentration analysis. Etherscan's own documentation confirms that its Holders tab displays indexed token balances in order of quantity. However, holder pages can be subject to indexing delays, pagination limits, or network-specific limitations.
Reading the Holders tab requires classifying non-individual wallets rather than simply discarding them. Burn addresses can be excluded from circulating ownership, but exchanges, bridges, and liquidity pools carry distinct structural risks (custodial dependencies, cross-chain bridge risk, or pool liquidity depth) and should be evaluated in separate categories.
Address-level holdings can be misleading when single entities control multiple wallets. An effective audit transitions from address-level to entity-level concentration:
- Identify top holding addresses.
- Label known exchanges, bridges, treasuries, vesting contracts, and liquidity pools.
- Cluster addresses controlled by the same entity using on-chain transfer patterns.
- Disclose the percentage of supply that remains in unidentified wallets.
Special attention should be paid to Unlocked Insider Concentration:
$\text{Unlocked Insider Concentration} = \frac{\text{Unlocked Tokens Controlled by Insiders}}{\text{Circulating Supply}}$
Scoring concentration (Heuristic screening thresholds):
- Top 10 non-exchange entity concentration under 20%: low risk.
- Top 10 non-exchange entity concentration 20% to 40%: moderate risk.
- Top 10 non-exchange entity concentration over 40%: high risk.
Putting the Rubric Together
None of these three metrics is disqualifying on its own. A token may have a wide FDV gap because it is early-stage, or a cliff-heavy vesting schedule. After all, those terms were negotiated before launch. Neither factor is automatically disqualifying.
What the rubric is built to catch is the combination: a token with a wide FDV gap, a large upcoming cliff, and high concentration in unlocked wallets is a fundamentally different risk than a token with only one of those three flags present.
A simple way to combine the three scores into a single supply-side risk read:
Metric | Low Risk | Moderate Risk | High Risk |
FDV vs Market Cap | Under 1.5x | 1.5x to 5x | Over 5x |
Vesting Structure | Linear, no unlock over 5% | Mixed, cliffs 5-15% | Cliffs over 15%, concentrated |
Top 10 Non-Exchange Holders | Under 20% of supply | 20% to 40% | Over 40% |
- A token scoring high risk on two or more axes warrants closer scrutiny. However, severe individual red flags act as critical risk overrides that supersede composite scores regardless of other metrics:
- Unlimited or owner-controlled contract minting function.
- Unverifiable total supply or unmapped cross-chain supply.
- Imminent insider unlock exceeding total available spot market liquidity.
- Single entity controlling both governance voting majority and treasury funds.
Additionally, risk scores should be paired with an Evidence Confidence Rating:
Metric | Risk Score | Evidence Confidence | Data Source / Basis |
FDV Gap | High | High | Verified smart contract & aggregator consensus |
Vesting Schedule | Moderate | Low | Unverified self-reported whitepaper documentation |
Concentration | High | Moderate | Top entity clustering with 25% unidentified holdings |
Bottom Line
Much of the required evidence for tokenomics forensics is publicly accessible. While primary on-chain data and block explorer records are free, complete historical emissions data, precise entity labels, and complex vesting schedules may require specialized research tools, archive node access, or private disclosures. The discipline isn't in finding the data. It's in checking it before allocating capital instead of after a cliff unlock has already moved the price.
Frequently Answered Questions
What's the difference between total supply and max supply, and does it matter for this rubric?
Total supply is the number of tokens actually created so far, minus anything burned. Max supply is the hard ceiling, the most tokens that could ever exist, whether or not they've been minted yet. FDV can be calculated against either figure, and different data platforms don't always agree on which one they're using.
For an uncapped or infinite-supply token like Ethereum, there's no max supply to compare against, so any dilution analysis has to lean on the emission rate instead of a fixed ceiling. Before comparing FDV figures across two tokens, confirm both are using the same supply base, since mixing a total-supply FDV with a max-supply FDV makes the comparison meaningless.
How often should these three metrics be rechecked after an initial audit?
Circulating supply and top-holder concentration can shift meaningfully within weeks, especially for a token with an active vesting schedule or recent listing, so treat the initial numbers as a snapshot rather than a permanent score. A practical rhythm: recheck immediately before any position-sizing decision, and again immediately before any known unlock date, since that's exactly when circulating supply and concentration both move at once. A rubric score from three months ago on a token with monthly emissions is functionally outdated.
Do all data platforms report circulating supply the same way?
No, and this is a common source of confusion. CoinGecko, CoinMarketCap, and similar aggregators each apply their own methodology for deciding which wallets count as uncirculated, and the specific treatment of large unlocked-but-inactive holdings, like a foundation treasury that technically could move tokens but hasn't, varies by platform.
Two sites can show meaningfully different circulating supply figures for the same token on the same day. When the FDV-to-market-cap gap looks unusual, checking the platform's own supply methodology page, not just the headline number, resolves most of these discrepancies.
Disclaimer: This article is for educational purposes only and is not financial, legal, investment, or tax advice. Tokenomics analysis carries inherent uncertainty, and past unlocks or concentration patterns do not guarantee future price behavior. Review all primary sources and seek professional advice before investing.