A stock lists and jumps 20% before lunch. The headlines call it excitement. The data tells a different story.
That first-day move has a name: underpricing. It is the gap between the offer price a company sells shares at and the price the stock closes at on day one. Since 1980, that gap has averaged 19.0% for US IPOs, according to Jay Ritter's IPO database at the University of Florida. The number moves with the deal itself. It sat at 15.3% in 2024. It jumped to 29.3% in 2025, with companies leaving a combined $13.1 billion on the table.
Pulling Ritter's raw year-by-year table directly instead of just the 45-year average shows how much these numbers actually swing; some individual years sit closer to 5%, others spike past 60%, which the long-run average alone hides.
This is not random noise. It is a documented, well-researched cost that companies pay to get their shares into the market smoothly. This piece summarizes the three leading academic explanations for why that cost exists, and what recent research into IPO filing language adds to the picture.
What Is IPO Underpricing?
Underpricing is the difference between what a company sells its shares for and what the market is willing to pay for them, once trading opens. If a stock is priced at $20 and closes its first day at $24, the deal was underpriced by 20%.
This gap is not a pricing mistake. Underwriters, the investment banks that manage an IPO and set its price, could technically price closer to the first-day close. They rarely do. Decades of data show the gap is structural. It shows up in nearly every IPO cycle, in nearly every market condition, at a fairly consistent average.
Formula, Measuring the First-Day Pop
Two calculations do most of the work in underpricing research.
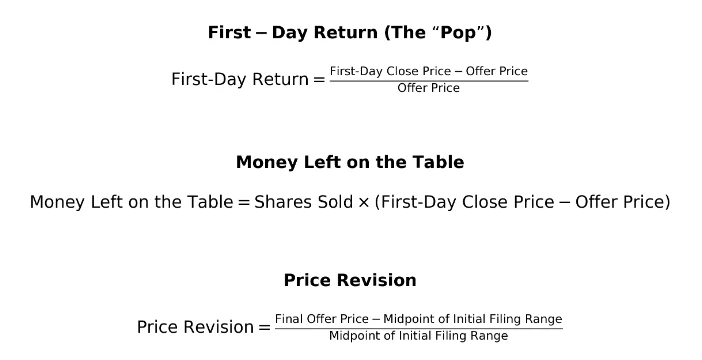
- First-Day Return: First-Day Return = (First-Day Closing Price − Offer Price) ÷ Offer Price
This measures the percentage move from offer price to first close.
- Money Left on the Table Money Left on the Table = Shares Sold × (First-Day Closing Price − Offer Price)
**First-Day Return (The “Pop”)** $\text{First-Day Return} = \frac{\text{First-Day Close Price} - \text{Offer Price}}{\text{Offer Price}}$ This shows how much the stock actually jumped (or dropped) on day one. **Money Left on the Table** $\text{Money Left on the Table} = \text{Shares Sold} \times (\text{First-Day Close Price} - \text{Offer Price})$ This is the total dollar amount the company “left behind” by pricing the IPO below what the market was willing to pay. **Price Revision** $\text{Price Revision} = \frac{\text{Final Offer Price} - \text{Midpoint of Initial Filing Range}}{\text{Midpoint of Initial Filing Range}}$ |
This measures the dollar cost of underpricing. A 20% pop on a small deal might cost a few million dollars. The same percentage on a multi-billion dollar offering can hand hundreds of millions to day-one buyers instead of the company.
Theory 1: The Winner's Curse
The most cited explanation comes from economist Kevin Rock, who published his model in 1986 in the Journal of Financial Economics. It borrows its name from auction theory, where winning a bid can mean you overpaid because you valued the item higher than everyone else did.
Rock's idea was later confirmed by empirical studies testing his model, which splits IPO investors into two groups:
- Informed investors, usually institutions with research teams, can tell a strong deal from a weak one.
- Uninformed investors, often retail traders, cannot make that distinction as reliably.
This creates an allocation problem. In a genuinely strong IPO, informed investors pile in, demand outstrips supply, and every investor, informed or not, gets only a small slice of shares. In a weak or overpriced IPO, informed investors stay away. Uninformed investors then receive a larger share of exactly the deal they should have avoided.
If this pattern kept repeating, uninformed investors would eventually stop participating in IPOs altogether, since they would lose money on average. Underpricing works as insurance against that outcome. It compensates uninformed investors for the risk of landing in a weak deal.
Several empirical studies support the allocation pattern Rock's model predicts. A study of Finnish IPO allocations found that returns adjusted for who actually received shares were consistently lower than the headline first-day numbers reported in the press. That gap is exactly what the Winner's Curse model predicts.
Theory 2: The Partial Adjustment Phenomenon
The Winner's Curse explains why underpricing exists. It does not explain why one IPO pops 5%, and another pops 50%. That gap is addressed by Kathleen Hanley's 1993 study in the Journal of Financial Economics, building on the theoretical framework Benveniste and Spindt introduced in 1989.
In the weeks before an IPO, underwriters run a roadshow, where company executives pitch the deal to institutional investors and gather feedback on demand at different price points. This process is called book-building.
Institutional investors have an incentive to understate their real interest, since a lower final price means more profit once trading begins. To counter this, underwriters reward investors who reveal genuine high demand through larger share allocations and by not raising the offer price as much as true demand would justify.
Hanley's research and Ritter's broader dataset show a consistent pattern:
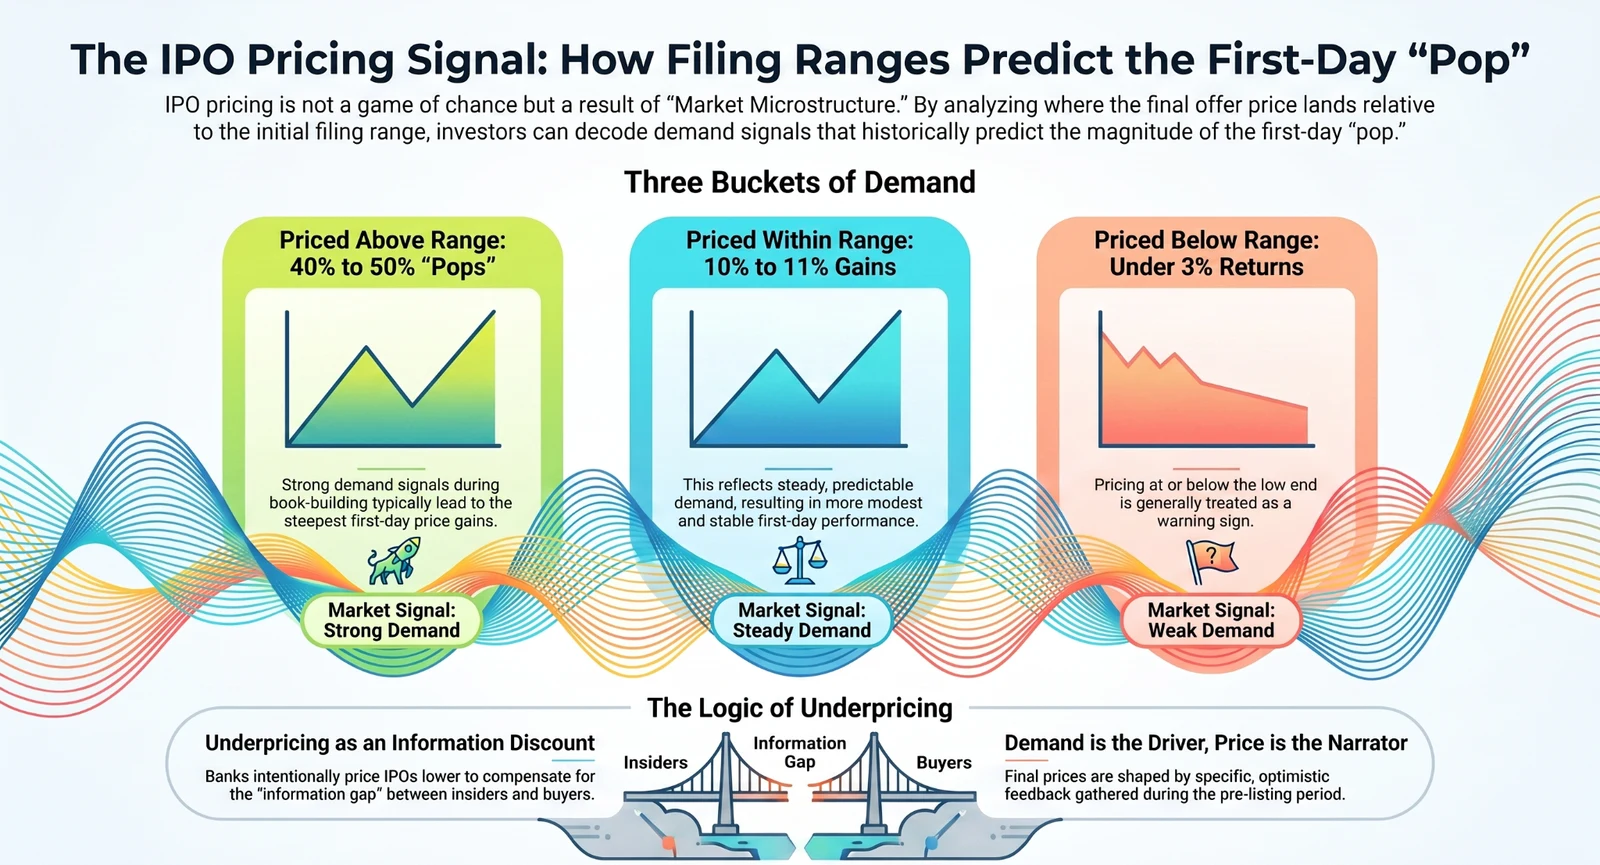
- Deals priced above the original filing range see much larger first-day pops, often 20% or more.
- Deals priced within the range see moderate pops, typically 10% to 12%.
- Deals priced below the range see minimal pops, usually 0% to 3%.
Renaissance Capital and other market participants treat pricing at or below the low end of a filing range as a caution signal. The final offer price is not just a number. It reflects real demand information collected during book-building, weeks before the stock trades.
Price Revision = (Final Offer Price − Midpoint of Initial Filing Range) ÷ Midpoint of Initial Filing Range
A positive price revision tends to predict a bigger first-day pop. This single figure is one of the most reliable signals available before a stock lists.
Theory 3: Certification and Information Risk
A third explanation looks at who runs the deal, not just how it is priced. Booth and Smith proposed the certification hypothesis in a 1986 paper in the Journal of Financial Economics. The idea is that a company going public borrows the reputation of its underwriter.
A top-tier bank has a lot to lose if it prices a bad deal or skips proper due diligence. Its involvement signals to the market that a party with real stakes has already reviewed the company. That reduces uncertainty for buyers, and less uncertainty generally means less underpricing is needed to attract them.
A related information-risk explanation comes from Ellul and Pagano's 2006 study in the Review of Financial Studies, based on 337 IPOs on the London Stock Exchange between 1998 and 2000. The study found a positive relationship between expected aftermarket illiquidity, how hard a stock is to trade once listed, and the size of the discount investors demand upfront. Harder-to-trade stocks get priced lower going in, as compensation for that added risk.
Private equity backing is sometimes cited as a similar certification signal, since an invested PE firm has its own reputation and capital tied to the outcome. The direction of that relationship is logically consistent with the certification hypothesis, though it deserves its own dedicated review rather than a passing mention here.
Textual Signals: What S-1 Language Adds
The newest layer of underpricing research does not come from financial ratios. It comes from language.
Every company files a Form S-1 with the SEC before it can sell shares to the public. Researchers now apply natural language processing, a branch of machine learning that analyzes written text, to study the actual wording of these filings.
A study by Loughran and McDonald, published in the Journal of Financial Economics, found that IPOs containing higher levels of uncertain or weak language saw bigger first-day returns, larger price revisions, and more aftermarket volatility. When a company sounds unsure of itself in its own filing, the market treats that as added risk, and underwriters price in a bigger discount as a result.
Newer research goes further, building predictive models that score S-1 filings section by section using machine-learning techniques such as Random Forest and Multilayer Perceptron. These models are still developing, and their reported accuracy depends heavily on sample design, feature selection, and out-of-sample testing. The broader finding stands on firmer ground: filing tone measurably correlates with pricing outcomes, even before the underlying financial data is fully priced in.
What Investors Should Watch Before IPO Day
The headline first-day pop is the least useful number to focus on. The more reliable signal is the path the price took during book-building.
Was the range raised, held steady, or cut before pricing? That single data point reflects real institutional demand gathered during the roadshow, and it is a far more dependable read than day-one headlines. Investors can check this directly by comparing a company's original S-1 filing against its final S-1/A amendment on SEC EDGAR, free of charge.
A large first-day pop also is not a forecast for long-term performance. Ritter's long-run data has repeatedly shown that IPOs with the biggest first-day pops tend to underperform over the following one to three years, compared to more modestly priced deals. A strong pop reflects day-one demand only, and it does not say anything about long-term fundamentals.
Limits of the Evidence
These three theories are not competing explanations. They describe different angles of the same underlying problem: at the moment of an IPO, the company and its underwriters know more about the business than public buyers do.
None of the studies cited here test tokenized or on-chain securities directly. The mechanics of price discovery under uncertainty are not unique to traditional equities, but applying these findings to newer asset structures is an informed comparison, not a tested conclusion. Readers modeling newer markets should treat that extension carefully.
Frequently Asked Questions
Does a big first-day pop mean the IPO was a good deal for the company?
Not necessarily. A large pop often means the company sold shares for less than the market was willing to pay, which is a cost, not a win, from the issuer's side.
Why don't companies just price their IPO at the expected first-day close?
Pricing that precisely is difficult without real demand data, and even small overpricing risks a failed or weak deal. Underpricing acts as a buffer that keeps demand strong and the deal moving forward.
Does a strong underwriter guarantee lower underpricing?
No. Underwriter reputation is one input among several. Market conditions, sector demand, and filing tone all influence the final discount as well.
Where can investors verify these patterns themselves?
Jay Ritter's IPO data page publishes free, downloadable tables on first-day returns by year. SEC EDGAR provides every S-1 and S-1/A filing for free, letting anyone track how a price range moved before listing.