Meta Desc: Master the math behind IPO book-building. Learn how underwriters use demand curves, investor tiering, and the Benveniste-Spindt model to set the final offer price.
The average IPO jumps about 19% on its first day of trading, based on decades of data from Jay Ritter's IPO database.
This article is about where that number actually comes from. It's not luck. It's the output of a two-week process called book-building, where underwriters (the investment banks running the deal) go out and figure out exactly what price the market will bear before the stock ever trades.
Once you understand this process, the first-day pop stops looking random and starts looking like a signal you can actually read.
Why Book-Building Exists in the First Place
When a company goes public, there's a real information gap between what the company and its bankers know and what outside investors know. That's called information asymmetry (one side having more or better information than the other).
Before book-building became the standard, underwriters set a fixed price before talking to anyone. That approach kept underpricing IPOs badly, because banks were essentially guessing. Book-building fixes this by turning the process into an information-extraction exercise. Underwriters go to large institutional investors (mutual funds, pensions, hedge funds) and ask two questions:
- How many shares do you want?
- At what price?
The academic foundation for how this actually works comes from Benveniste and Spindt's 1989 paper in the Journal of Financial Economics, which modeled book-building as a mechanism designed to get asymmetrically informed investors to reveal what they actually know. Their core insight was simple. Investors who tell the truth about strong demand get rewarded with better share allocations and a bit of built-in underpricing.
Investors who lowball their interest to try to push the price down risk getting cut out of future deals entirely.
That's the whole game. It's a repeated relationship between banks and their regular institutional clients, and the incentive structure only works because the same funds keep coming back deal after deal.
The Formulas Underwriters Actually Use
Once demand comes in, a few core calculations tell the bank how healthy the deal looks:
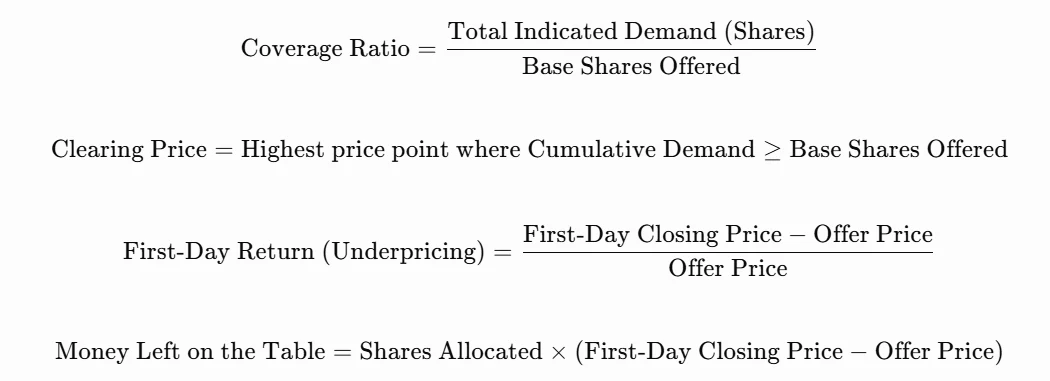
- Coverage Ratio
Coverage Ratio = \frac{\text{Total Indicated Demand (Shares)}}{\text{Base Shares Offered}}
This shows how many times a deal is oversubscribed.
- Clearing Price
Clearing Price = \text{Highest price point where Cumulative Demand} \ge \text{Base Shares Offered}
This is the price where demand fully covers the offering.
- First-Day Return (Underpricing)
First-Day Return (Underpricing) = \frac{\text{First-Day Closing Price} - \text{Offer Price}}{\text{Offer Price}}
This measures the percentage gain on listing day.
- Money Left on the Table
Money Left on the Table = \text{Shares Allocated} \times (\text{First-Day Closing Price} - \text{Offer Price})
This shows the dollar value missed at pricing.
The last one matters more than people give it credit for. A 20% first-day pop on a small deal might mean a few million dollars. The same percentage on a multi-billion dollar offering means hundreds of millions handed to day-one buyers instead of landing on the company's own balance sheet.
The Three Types of Bids Underwriters Actually Collect
The formal process kicks off with a roadshow, a series of presentations where company executives pitch directly to big investors. During this window, investors submit IOIs (Indications of Interest, which are non-binding, meaning nobody is locked in yet). These generally come in three forms.
- Limit bids state an exact share count and the maximum price the investor will pay. These are the most useful to the bank because they show precisely where a buyer walks away.
- Market orders simply say "I want X shares at whatever price you land on." These show enthusiasm but give the bank almost no help figuring out where real price resistance sits.
- Step bids are staggered. An investor might want a million shares at $20, half that at $22, and a fifth of that at $24. This gives underwriters a genuine, granular picture of the demand curve instead of a single data point.
A Worked Example: From Raw Bids to a Final Price
This is an illustrative, hypothetical example built to show the mechanics clearly, not data pulled from an actual deal.
Say a company wants to sell 10 million shares, with an initial indicative range of $18.00 to $22.00. As bids come in, the bank stacks them from highest price down to lowest to build a cumulative demand curve:
Price Point | Cumulative Demand (M Shares) |
$23.00 | 2 |
$22.50 | 3.5 |
$22.00 | 6.5 |
$21.50 | 7.5 |
$21.00 | 10.0 (theoretical clearing price) |
$20.50 | 10.5 |
$20.00 | 11.5 |
At $21.00, cumulative demand exactly matches the 10 million shares on offer. That's the theoretical clearing price. But pricing right at that edge is risky. If even one large order falls through, the deal could go undersubscribed on the spot. So the bank typically prices a notch below, say $20.50, where demand runs to 10.5 million shares.
That gives the deal a small cushion (1.05x oversubscribed) and leaves early buyers a bit of first-day upside, exactly the partial adjustment dynamic described above.
Why the Offer Price Often Sits Below the Clearing Price
Here's the part that surprises people. Even when demand is clearly enormous, underwriters don't raise the price all the way to the true market-clearing level. They stop short on purpose. This is called partial price adjustment, and it was documented empirically by Kathleen Hanley's 1993 study, building directly on the Benveniste-Spindt framework.
The logic is straightforward once you see it. If a bank priced every hot deal exactly at the market-clearing price, institutional investors would have zero reason to reveal genuine enthusiasm during book-building.
Why show your hand if there's no reward for it? By leaving a bit of upside on the table, the bank keeps big funds honest and willing to participate in future deals. It's sometimes described as an information rent, a small, deliberate cost paid to keep the whole system functioning.
Gathering Demand Before the Roadshow Even Starts
Banks don't wait until the roadshow to start gathering signals. In Europe, this earlier phase is called PDIE (Pre-Deal Investor Education); it is a two-week window, unique to European IPOs, where syndicate analysts distribute research reports and quietly gauge investor reaction before the price-range prospectus is even published.
Recent academic research on this exact phase found that investors who engage earlier and more substantively during PDIE tend to receive more favorable allocations once book-building formally begins.
In the US, the equivalent tool is TTW (Testing-the-Waters), a provision that started under Section 5(d) of the JOBS Act in 2012 for emerging growth companies and was expanded to all issuers under SEC Rule 163B in 2019. TTW lets companies have confidential conversations with QIBs (Qualified Institutional Buyers, generally large institutions managing at least $100 million in securities) before committing to a full roadshow.
It's a way to sanity check appetite before spending millions on legal and marketing costs.
Not All Investors Are Treated Equally
Banks tier institutional investors deliberately, because who gets shares matters just as much as the price itself.
Tier | Investor Type | Allocation Priority |
Tier 1 | Anchor institutions (mutual funds, pensions, sovereign wealth funds) | Highest, large allocations, long holding periods expected |
Tier 2 | Specialized sector funds doing deep research | Medium, tied to quality of pricing feedback given |
Tier 3 | Momentum traders and flippers | Lowest, often cut back sharply on hot deals |
The reason for this is simple. Prioritizing Tier 1 anchors protects the company from flippers (investors who sell immediately for a quick profit), since heavy day-one selling can crash the stock before it has a chance to find a stable trading range.
Here's a second illustrative example, again constructed for clarity rather than pulled from a real filing.
For example, if a company sells 20 million shares in a $25 to $30 range. At $32, above the range, the coverage ratio might be only 0.75x, technically a rejection, even if the demand that does exist is high quality. At $28, the book might show 6.00x coverage, but if 80 million of those shares come from short-term Tier 3 traders, that "strong" book is actually a volatility risk waiting to happen.
At $30, coverage settles around 2.25x, with Tier 1 anchors alone covering the entire float. That's usually the sweet spot banks look for: enough coverage to confirm demand, without leaning on buyers likely to dump the stock on day one.
The Greenshoe: A Quick Note on the Safety Net
Once the price is set, underwriters often oversell by up to 15% using the greenshoe option (formerly an overallotment option), giving them room to buy shares back if the stock wobbles after listing.
A real-world example of this at massive scale: when SpaceX went public in June 2026, underwriters Goldman Sachs and Morgan Stanley fully exercised the greenshoe, expanding the deal from an initial $75 billion raise to $85.7 billion, after the stock rose 19% on its debut and closed near $161 a share. That aftermarket stabilization process is exactly what determines whether a stock holds steady or slides in its first 30 days of trading.
Where This Shows Up in SEC Filings
None of this is theoretical once a deal is live. Every company files a Form S-1 (a registration statement filed with the SEC before shares can be sold to the public) with an indicative price range printed right on the cover, plus a Plan of Distribution section spelling out the exact greenshoe size and lockup terms.
Reddit's actual 2024 S-1 filing shows exactly what this looks like in practice: the filing states plainly that "we anticipate that the initial public offering price per share of our Class A common stock will be between $31.00 and $34.00," language that only appears once book-building has actually narrowed the range down from a blank cover page.
Once book-building wraps and the price is locked in, the company files a Form 424B4 with the final offer price and the gross spread (the underwriting fee, typically in the 3% to 7% range for a standard-size deal). Reading these filings closely for valuation signals is exactly what the S-1 Filing Analysis Framework is built to help with.
The Honest Limitation of This Process
Book-building isn't perfect. Because underwriters have full discretion over who gets allocated shares, the process has long faced criticism for favoring investors who generate other, unrelated trading revenue for the bank rather than the funds most likely to hold long-term. That discretion is a feature of the design, not a flaw exactly, but it's worth knowing about if you're trying to understand why allocation outcomes sometimes look inconsistent from the outside.
Frequently Asked Questions
Does book-building work the same way for a direct listing or a SPAC?
No. Book-building is specific to the traditional underwritten IPO structure. Direct listings set price through a single opening auction with no book-building phase at all, and SPACs set price through private negotiation between the sponsor and target company.
Can a deal get pulled entirely during book-building if demand looks weak?
Yes, and it happens more often than most people assume. If indicated demand comes in well below the base offering at any reasonable price, the company can lower the range, shrink the deal size, or withdraw the offering altogether rather than price into a deal that's likely to trade poorly.
Why do step bids matter more to a bank than a single limit bid?
A step bid effectively hands the underwriter several data points instead of one, showing exactly how demand shrinks as price rises. That's far more useful for constructing an accurate demand curve than a single limit price, which only tells the bank one investor's ceiling.
Is the indicative price range set before or after PDIE and testing-the-waters conversations happen?
After. Both PDIE in Europe and TTW in the US happen before the formal price range is published in the prospectus. The feedback gathered during these earlier conversations is part of what shapes where the bank sets that initial range in the first place.
Does a company have any say in how shares get allocated, or is that entirely the bank's call?
Underwriters hold the final pen on allocation, but companies typically negotiate some input upfront, particularly for reserving shares for employees, board members, or directed share programs. The bulk of institutional allocation decisions, though, remain the bank's discretion.