
More than 8,000 startup opportunities entered the venture selection process examined by Young Soo Jang and Steven Kaplan. Their 2025 NBER working paper found evidence that the investor could identify stronger opportunities, yet the outcomes remained noisy.
Among the 114 companies it backed, 32% later raised more than $10 million, and 13% raised more than $25 million. These figures measure subsequent financing, not exits or realized investor returns.
That gap between a promising score and an investable result is the central challenge in algorithmic deal screening.
Institutional teams may receive hundreds of pitch decks, data-room invitations, and tokenized-asset proposals every month. Automated screening can extract information and move a smaller group of opportunities to the top of the research queue. The potential time savings are real. Predictive validity is a separate question.
Private-market evidence is sparse, revised after the fact, and uneven across sectors. Outcomes can take years to mature. Failed companies may disappear from commercial databases, while rejected deals rarely receive the same follow-up as funded companies. Transactions may be public even when related wallets, insider control, and executable liquidity remain unclear.
The question for an investment committee is therefore precise:
What evidence justifies trusting this score for this investment decision?
A defensible answer requires a defined prediction target, dated source records, a later-vintage test, suitable performance measures, and documented failure limits. The model must be treated as a risk-bearing decision tool rather than a product feature.
What an Algorithmic Deal-Screening Model Actually Predicts
A deal-screening model converts company, market, financial, textual, or on-chain evidence into a ranking, probability, or risk category. Its purpose is to help analysts decide where deeper investigation should begin.
Four different functions often sit behind the same platform label.
- Deal discovery identifies companies or tokenized opportunities that match an investment mandate. Filters may cover geography, sector, financing stage, revenue profile, or asset structure.
- Information extraction turns pitch decks, filings, and technical documents into structured fields. It may capture financing dates, named customers, cap-table rights, vesting schedules, or governance provisions.
- Deal ranking orders a pipeline according to expected relevance. This becomes useful when a team can review 20 opportunities from a monthly intake of 1,000.
- Outcome prediction estimates whether a defined event will occur within a fixed period. That event may be a follow-on round, revenue threshold, down round, shutdown, acquisition, default or minimum liquidity level.
Each task requires a different validation design.
Classification estimates whether an event occurs. Learning-to-rank methods order opportunities. Survival models estimate time until funding, failure, or exit. Regression estimates a continuous value such as revenue growth or valuation.
A target described only as “deal quality” cannot be tested rigorously. Quality may refer to growth, governance, technical strength, financing progression, downside protection, or investment return. These outcomes are related, but they are not equivalent.
A valid prediction target is explicit:
Estimate the probability that a Series A software company raises at least $20 million within 36 months, using only information available on its original screening date.
This target fixes the population, outcome, horizon, and information boundary.
It also prevents a common overclaim. A model that predicts follow-on financing has not automatically demonstrated an ability to predict investor returns. Likewise, a sourcing engine can find relevant companies without identifying eventual winners.
The predicted event should be connected explicitly to the investment decision. Otherwise, the model may optimize a measurable proxy that has weak economic relevance
The score should guide research effort. Ownership rights, management claims, valuation, product evidence, custody, liquidity, and portfolio fit still require specialist review. The related cluster on human versus algorithmic due diligence should examine where analysts and models make different errors rather than declare one method universally superior.
How the Model Architecture Converts Evidence into a Score
A defensible system is a controlled evidence pipeline. It preserves what was known at the decision date, turns raw inputs into explainable features, compares complex methods with simple baselines, and records how each output was produced.
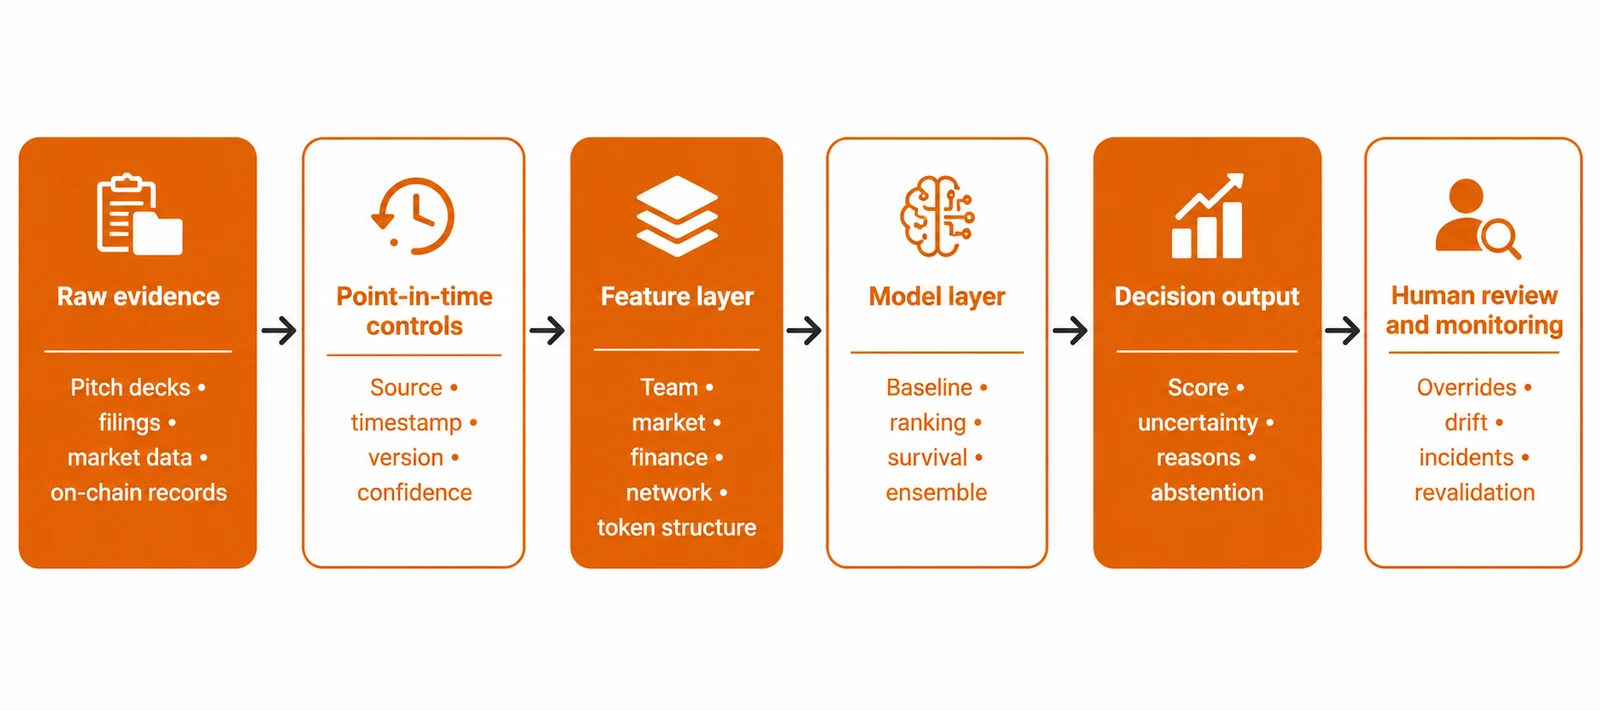
The Evidence Layer Must Preserve History
Inputs may include pitch decks, company websites, data-room files, regulatory filings, cap tables, financing records, hiring data, patents, product repositories and market datasets.
A tokenized opportunity may add smart contracts, wallet distribution, circulating supply, vesting schedules, exchange depth, bridge activity, and governance participation.
Each observation needs an identifiable source, capture date, version, confidence level, and revision history. It also needs proof that the information existed before the screening cutoff.
A company screened in January 2023 may now show $80 million in funding, 250 employees, and operations in three countries. If the original record showed $8 million, 40 employees, and one market, the current profile cannot be used to recreate the earlier decision.
Doing so creates look-ahead leakage. The historical test receives information that was unavailable when the decision was made.
This error can arise without deliberate manipulation. Data vendors revise funding totals, employee estimates, investor identities, and company categories. News dates also differ from transaction dates. A round that closed in January but became public in March cannot enter a January feature set unless the investor had documented access to it at that time.
Historical snapshots, publication timestamps and vendor revision logs form the foundation of private-market feature engineering and data lineage.
Features Need An Economic Rationale
Raw evidence becomes useful after it is translated into measurable features.
Team features may cover relevant
- Operating experience,
- Technical depth,
- And employee retention.
Market features may describe category growth, competitive density, and customer concentration. Financial features may include revenue growth, gross margin, burn rate, runway, and funding velocity.
Tokenized opportunities introduce variables such as wallet concentration, circulating supply, vesting exposure, liquidity depth, and governance participation.
Economic rationale should guide feature selection, but it does not establish causality. The feature must still demonstrate stable out-of-sample value..
Rapid hiring can signal expansion or weak cost control. Fast fundraising may reflect outside confidence or a sequence of insider-supported rounds. High transaction counts may indicate adoption or coordinated wallet activity.
Missing values also need separate treatment. A blank revenue field can mean zero revenue, non-disclosure, weak vendor coverage or that the metric does not apply. Merging those states may teach the model about reporting behavior rather than investment quality.
The model should distinguish:
- missing because it was not requested,
- missing because the company refused,
- unavailable from the vendor,
- not applicable,
- structurally zero,
- lost during data processing.
Missingness itself may be predictive, but relying on it can also encode platform access, geography or analyst behavior.
Text Analysis Should Separate Claims From Evidence
Natural-language processing (NLP) can extract entities, dates, counterparties, and financial claims from long documents. Its first job should be evidence organization, not sentiment scoring.
This controls for:
- source hierarchy,
- claim-level citations,
- contradiction detection,
- extraction confidence,
- date resolution,
- unit normalization,
- human verification of material fields,
- Prompt and model versioning.
For investment use, an extracted fact should remain linked to the exact supporting passage.
Management language is designed to persuade. A forecast of rapid global expansion is not equivalent to signed customer contracts. Several news reports may also repeat one company announcement. Counting each report as independent evidence inflates the signal.
A stronger pipeline traces the original source, removes duplicates, and labels statements as verified facts, third-party reports, or management projections.
Models trained on public-company filings also need separate testing before use on startup decks, token announcements or technical whitepapers. This domain-shift problem belongs in the cluster of NLP funding-news sentiment failures.
Model complexity must earn its place
Logistic regression provides an interpretable baseline for binary outcomes. Gradient-boosted trees can capture nonlinear patterns in structured data. Ranking methods fit shortlist construction, while survival models handle the time until an event. Ensembles can combine financial, textual, and on-chain evidence.
A complex method should first outperform:
- Random ranking
- Sector and stage averages
- A written investment scorecard
- Logistic regression
- The current analysis process
- The previous production model
The output should contain more than one number. Institutional users need the model version, operating threshold, confidence estimate, and reason codes.
They also need an abstention rule.
When sources conflict, critical fields are absent, or a company lies far outside the training distribution, “insufficient evidence” is more credible than a precise score with no dependable basis.
How to Validate Performance Without Contaminating the Backtest
Validation begins before training. The investment team must define the outcome, observation period, and economic decision that the score will support.
Follow-on financing, revenue attainment, default, shutdown, acquisition, and token-liquidity survival are different targets. None is a universal measure of success.
Another funding round may show market demand without proving capital efficiency. An acquisition can produce a strong return or mark a distressed sale. A liquid token can still lose most of its value.
Mature Outcomes Need a Fixed Clock
Private-market events unfold slowly. A company screened in 2025 cannot be judged by the same exit standard as one screened in 2015. A company without an observed exit may still be operating.
Validation should compare similar vintages and use fixed observation windows. Survival methods are appropriate when the target is time until funding, failure or exit.
Rejected opportunities should remain in the evaluation universe wherever records allow. Funded companies receive capital, introductions, and credibility that can alter their future. A portfolio-only dataset cannot measure the opportunity cost of rejected deals.
The investment decision itself partly causes observed outcomes. Comparing selected and rejected companies without accounting for this intervention may confuse investor impact with selection skill.
Time Must Move Forward
Random train-test splits can create unrealistic performance.
If opportunities from 2018 through 2025 are shuffled, companies from 2024 may enter training, while companies from 2019 enter testing. The model then learns from a later market before it is evaluated on an earlier one.
A credible private-market backtest should follow the real decision timeline:
- Train on older deal vintages.
- Select features and tune parameters within that historical period.
- Validate on a later untouched vintage.
- Test once on the newest period with mature enough outcomes.
- Report whether performance survives different market conditions.
The final test period must remain isolated until development is complete. Filing dates, announcement delays, duplicate events, and vendor revisions must follow the same rule.
These controls are the core of point-in-time out-of-sample backtesting.
C. Current Research Shows Why the Split Matters
DIALECTIC, published in the EACL 2026 industry track, uses multiple language-model agents to gather startup information, build arguments for and against investment, and produce decision scores.
Researchers tested it on 259 historical startup opportunities from five venture funds. 25% of the companies met the paper’s success definition, which was raising a Series A or later round by September 1, 2025.
The paper reported a test PR-AUC of 0.2422 and precision comparable with participating investors at selected thresholds.
The dataset, however, was divided through random stratified sampling into 129 validation and 130 test companies. The human benchmark covered six investments, two of which met the success definition. More than 90% of the original company records were excluded while the researchers applied temporal and availability controls.
Because approximately 25% of the sample met the success definition, the reported test PR-AUC of 0.2422 was close to the no-skill level commonly associated with positive-class prevalence. The precise comparison depends on how PR-AUC was calculated, so this should be treated as a cautious interpretation rather than a definitive finding
The research demonstrates a structured and interpretable screening process. Its aggregate result does not yet establish durable later-vintage performance or live portfolio value.
A performance metric has little meaning unless the reader can see the base rate, sample, split, threshold, and benchmark behind it.
D. Model Selection Needs an Audit Trail
Historical results become easier to overstate as researchers test more features, algorithms, and thresholds.
Bailey, Borwein, López de Prado and Zhu developed a framework for estimating the probability of backtest overfitting in investment simulations. Their published paper explains why conventional holdout methods can be unreliable when many strategies are tested, and only the strongest in-sample result is selected.
Although their framework was developed for investment strategies, the same selection problem applies to deal scoring. Testing hundreds of configurations and reporting only the winner can make noise appear useful.
A validation report should disclose:
- The original feature universe
- Removed variables and the reasons
- Model families and parameter searches
- Selection criteria
- Rejected specifications
- The untouched test period
- Negative or inconclusive findings
E. Metrics Must Reflect the Operating Decision
A fund that can review 20 opportunities each month should measure performance among the top 20 recommendations. A platform that displays probabilities should also show whether those probabilities are calibrated.
Metric | What it measures | Best use | Main limitation |
Precision at K | Share of top-ranked deals that reach the target | Limited analyst capacity | Ignores qualifying deals below K |
Recall at K | Share of all qualifying deals captured | Measuring missed opportunities | Can reward an oversized shortlist |
PR-AUC | Precision and recall across thresholds | Imbalanced outcome labels | Must be compared with the positive-class rate |
Brier score | Accuracy of probability forecasts | Testing calibration | Can hide weak subgroup performance |
Lift | Improvement over a simple baseline | Comparing screening efficiency | Changes with sample and base rate |
Expected value | Benefit after diligence costs and losses | Capital allocation | Depends on uncertain payoff assumptions |
Vintage stability | Consistency across periods | Detecting regime dependence | Requires enough mature outcomes |
Accuracy alone is weak when positive outcomes are rare. A model that labels every company unsuccessful may look accurate while finding none of the desired deals.
False positives and false negatives also carry different costs.
- A false positive consumes diligence resources and may lead to capital loss.
- A false negative can remove the rare company that drives a large share of portfolio returns.
The operating threshold should reflect review capacity, ticket size, concentration limits, liquidity, and downside tolerance.
Where Private-Market and Crypto Models Break
Private-market modeling operates with sparse, delayed, and selected outcomes. These conditions increase the risk of leakage, overfitting, survivorship bias, and performance drift.
Failure mode | Diagnostic sign | Practical control |
Look-ahead leakage | Results fall after dated snapshots are enforced | Apply decision-date cutoffs to every field |
Survivorship bias | Results weaken when failed and rejected deals return | Preserve the original opportunity universe |
Small-sample overfitting | Performance changes sharply across folds or seeds | Use simple baselines and later-vintage tests |
Concept drift | Calibration varies by vintage | Set monitoring and revalidation triggers |
Text evidence inflation | Many documents trace to one announcement | Deduplicate sources and trace original claims |
Proxy bias | Results vary sharply across groups | Test subgroups and justify proxy variables |
On-chain misattribution | Wallet growth conflicts with entity activity | Cluster addresses and reconcile off-chain records |
Liquidity illusion | Volume disappears under realistic trade size | Measure depth, slippage and withdrawal capacity |
Sparse Labels Create Unstable Relationships
A database may contain thousands of companies, but only a small number of mature exits, shutdowns or realized returns. Once the sample is divided by
- Stage,
- Sector,
- Geography
- And vintage,
The usable count falls further.
Large feature sets can then fit relationships that do not repeat. Regularization and feature reduction help, but neither replaces a later-vintage test.
Historical Databases Lose Failures
Commercial platforms usually preserve visible and funded companies better than dead or abandoned ones.
Failed startups lose websites. Delisted tokens disappear from common screens. Rejected deals may never receive detailed follow-up.
A dataset rebuilt today can make an older opportunity set look cleaner than it was. Credible records retain failures, delistings, name changes, unresolved outcomes, and rejected opportunities.
Relationships Change With the Market
The meaning of a feature can change across cycles.
Rapid hiring may signal expansion when financing is available and weak cost discipline when capital tightens. Fast fundraising may indicate outside confidence in one period and speculative excess in another.
Token-liquidity indicators may work during a broad rally and fail when exchange activity contracts.
Production monitoring should report ranking quality and calibration by vintage, with defined thresholds for recalibration, redevelopment, or suspension.
Blockchain Precision Can Hide Economic Error
On-chain records are transparent, but attribution is not always clear.
One organization may control hundreds of addresses. Exchanges pool assets for many users. Bridge transfers can look like new demand when the same assets move between networks. Wash trading, Sybil activity, related wallets, and contract migrations add further uncertainty.
A model may calculate transaction growth or wallet concentration precisely while measuring the wrong economic behavior.
For tokenized private-market assets, token mechanics must also be separated from legal rights. A transferable token does not establish enforceable equity ownership, redemption priority, dependable secondary liquidity or protection during issuer default.
On-chain activity should be reconciled with contracts, custody records, cap tables, and financial statements. The supporting clusters on timestamped on-chain track-record verification, wallet concentration analysis, and quantitative due diligence should address these controls in depth.
What Institutional Buyers Should Demand
A production deal score should be governed according to the financial consequences of being wrong.
On April 17, 2026, the Federal Reserve, OCC, and FDIC issued SR 26-2, replacing SR 11-7 and SR 21-8. The revised guidance adopts a risk-based approach tied to model purpose, exposure, materiality and organizational complexity. It also states that the guidance does not create enforceable standards or prescriptive requirements.
Its direct scope needs careful wording. The Federal Reserve says SR 26-2 is expected to be most relevant to supervised banking organizations with more than $30 billion in total assets.
A May 2026 speech by the Federal Reserve Vice Chair for Supervision also stated that the revised guidance applies narrowly to traditional models and basic applications rather than generative or agentic systems. Private-market platforms should use its development, validation and governance principles as a benchmark, not claim universal compliance.
NIST’s 2023 risk-management framework offers broader lifecycle guidance through Govern, Map, Measure and Manage. It treats testing, evaluation, verification and validation as continuing activities and places governance across the full system lifecycle.
Every production model should have:
- A named owner
- A documented intended use
- Clearly prohibited uses
- Defined training and validation periods
- Listed data dependencies
- A version history
- Current validation status
- Known limitations
- Review and retirement dates
Developers can explain the design. An independent reviewer should challenge the data construction, assumptions, benchmarks, and performance claims.
After launch, the investment team should monitor score distributions, calibration, overrides, missed deals, vendor failures, and attribution errors.
Before using a platform, an institutional buyer should ask:
- What exact event and time horizon does the score predict?
- Were all inputs available on the original decision date?
- Are failed, rejected and unresolved opportunities represented?
- Which vintages were used for training, validation and testing?
- Was the final test period untouched during development?
- How many features and configurations were evaluated?
- Did the model beat simple and human baselines?
- Are probabilities calibrated by stage, sector and vintage?
- Can the system abstain when evidence is incomplete?
- Who reviews overrides, drift, and material changes?
Warning signs include training performance presented as validation, current database values used in historical tests, no rejected-deal population, no simple benchmark, and a proprietary score with no defined target.
A credible deal score requires a defined target, dated evidence, later-vintage testing, comparison with simple baselines, calibrated outputs, an abstention rule, independent review, and transparent limitations.
Used within those boundaries, automated screening can reduce repetitive work and make investment review more consistent. It can surface missing evidence, standardize comparisons and preserve an audit trail.
It cannot turn an incomplete private-market record into certainty.
FAQs
What is an algorithmic deal-screening model?
It is a system that converts company, market, financial, textual or on-chain evidence into a ranking, probability or risk category. It supports investment triage and identifies where deeper research should begin.
What is the best backtesting method for private-market machine learning?
There is no universal design. At a minimum, the test should preserve chronology, use point-in-time evidence, isolate the newest evaluation period from model selection, and report performance by deal vintage.
Can a deal score replace investment due diligence?
No. It can prioritize opportunities, organize evidence and flag anomalies. It cannot independently verify ownership rights, management claims, contractual protection, product quality or portfolio suitability.
Research methodology
This article prioritizes official supervisory guidance, NIST publications, and published academic research. The Jang and Kaplan source is identified as an NBER working paper. The DIALECTIC evidence comes from an EACL 2026 industry-track paper. The backtest-overfitting framework comes from the Journal of Computational Finance. Individual studies are used to explain methods and limitations, not to promise investment performance.
Investment risk notice
Deal-screening outputs are research tools. They do not guarantee investment performance and are not substitutes for legal, tax, financial, technical or regulatory advice.