
A 2026 token-level study across three major RWA categories (BUIDL, BENJI, OUSG, USTB, USDY, SCOPE, STAC, PAXG, and XAUT) found that outstanding asset value did not reliably predict observed liquidity. Turnover, trading persistence, and active participation mattered more. Although the sample excluded property tokens, the finding frames the central issue in real estate tokenization liquidity: a valuable asset on-chain is not necessarily easy to sell.
tZERO says its True Settlement system can book cash and a digital security simultaneously on T+0. It also identifies the St. Regis Aspen Resort as a tokenized real estate investment in its ecosystem. This confirms an operating issuance and settlement route, but not how much of the security can trade near the displayed price.
tZERO provides digital-securities infrastructure and marketplace services. |
For an allocator, three questions matter. How much can be sold, what discount will the order create, and how long will the exit take?
This analysis treats unavailable market data as a finding rather than filling the gap with unsupported estimates.
The St. Regis Aspen Test: What Public Evidence Can and Cannot Prove
A defensible review needs a fixed window and reproducible data. For July 1, 2025, through June 30, 2026, the required records include time-stamped quotes, executions, cancellations, volume, block trades, auction results, transfer restrictions, and investable free float.
tZERO describes three exit routes for tokenized securities:
- Continuous central limit order-book trading,
- Privately negotiated blocks,
- And auction events.
Its public material also presents St. Regis Aspen as a real estate security available through the platform.
Methodology Box Measurement window: July 1, 2025, to June 30, 2026 |
The public pages reviewed here do not publish a complete historical order book for the Aspen security. They cannot support a defensible median spread, annual turnover, zero-trade ratio, or $100,000 slippage estimate.
That does not prove illiquidity. It means public evidence is insufficient to measure asset-level depth. A buyer needs a venue-authenticated export, issuer-approved report, or direct broker data before treating secondary-market access as reliable liquidity.
Blockchain transfers cannot replace those records. Wallet movements may reflect issuance, redemption, custody changes, collateral movement, or internal transfers. Only verified arm’s-length executions belong in trading-volume calculations.
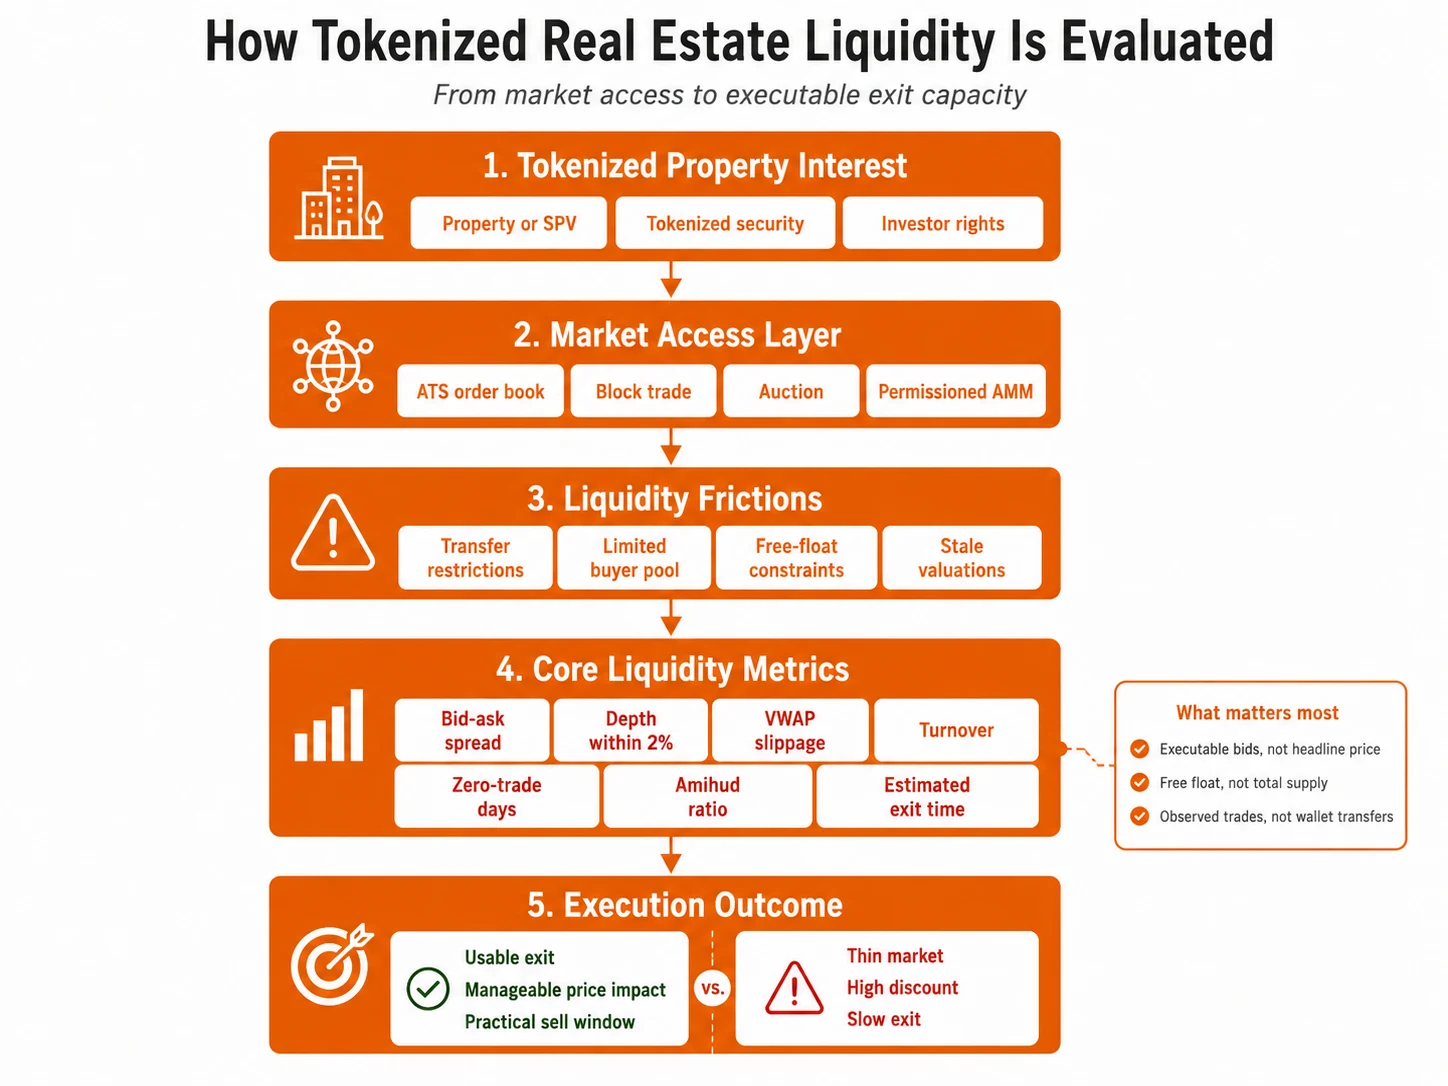
The Metrics That Reveal Real Exit Capacity
A quote has little meaning without size. The first measure is the relative bid-ask spread:
- Relative spread = (best ask - best bid) ÷ midpoint × 100
The midpoint is the average of the best bid and the best ask.
A $9.50 bid and a $10.50 ask produce a midpoint of $10 and a quoted spread of 10%. However, the result says nothing about how many tokens are available at either price.
Depth closes that gap. Add all executable bids and offers within 1% and 2% of the midpoint. Report the buy and sell sides separately, both in dollars and as a percentage of investable free float.
Free float matters more than total token supply. A large share of an issuance may be locked, controlled by the sponsor, held by insiders, or unavailable for resale.
Next, simulate a sale through each bid level. Seller-side slippage is calculated as:
- Exit slippage = (arrival price - execution VWAP) ÷ arrival price × 100
VWAP means volume-weighted average price.
Test several realistic exit sizes:
- $5,000
- $25,000
- $100,000
- 0.25% of free float
- 0.5% of free float
- 1% of free float
These calculations show whether fractional ownership supports only small transactions or can absorb a meaningful portfolio adjustment.
Turnover adds the time dimension:
- Annual turnover = annual executed value ÷ average investable free-float value
Use verified arm’s-length executions only
The figure becomes more useful when paired with the percentage of zero-trade days, median time between executions, number of independent buyers, and concentration of volume among the largest participants.
A burst of trading around one distribution date should not be mistaken for continuous liquidity.
The Amihud ratio estimates the price movement associated with each dollar traded:
- ILLIQ = average of |daily return| ÷ daily dollar volume
Use executed prices rather than issuer-reported NAV values. Zero-volume days must be reported separately because repeated zero returns may reflect stale pricing rather than market stability.
Finally, estimate the time needed to unwind a position:
- Estimated exit time = position size ÷ stressed executable daily buy volume
A stressed volume measure is more useful than the annual average because thin markets often concentrate most activity in a small number of sessions.
Measure | What it captures | Institutional test |
Relative spread | Cost of crossing the market | Is the quote economically usable |
Depth within 2% | Capital available near the midpoint | How much can exit without a steep discount |
VWAP slippage | Price impact across bid levels | What will the sale actually receive |
Free-float turnover | Trading relative to available supply | Is the activity meaningful for the issue size |
Zero-trade ratio | Continuity of executions | Is liquidity persistent or episodic |
Amihud ratio | Price movement per dollar traded | How sensitive is price to order flow |
Stressed exit time | Days needed to unwind | Can the fund meet its liquidity horizon |
What Happens When a Large Order Reaches a Thin Book
Suppose the latest trade is $10.00. The best bid is $9.80, but it covers only 100 tokens. Lower bids sit at $9.20, $8.60, and $7.90. A small seller may trade close to the screen price. A fund selling 10,000 tokens would consume several levels and receive a much lower VWAP.
The last trade, current quotes, issuer NAV, and latest property valuation must be viewed together. The trade is historical. A bid shows demand at one price and size. NAV follows the issuer’s valuation policy. An appraisal estimates property value on a specific date.
A token discount can reflect stale appraisal data, weaker rental income, refinancing pressure, concentrated ownership, transfer restrictions, or uncertainty about the SPV. Order-book data will not identify the cause by itself, but it reveals the price at which fresh supply can be absorbed.
Eligibility rules can shrink the buyer pool further. Accreditation tests, jurisdiction limits, sanctions screening, holding periods, and transfer-agent controls may block an otherwise willing counterparty.
In the United States, an ATS (Alternative Trading System) using the exchange-registration exemption must register as a broker-dealer and comply with Regulation ATS in the United States. The SEC states that Form ATS is a notice rather than Commission approval; its published list included data through May 31, 2026.
Legal rights also influence marketability. SEC staff statement distinguishes issuer-sponsored, third-party custodial, and synthetic structures with different holder rights and intermediary risks in January 2026. The document is non-binding.
Where Order Books and Permissioned AMMs fit
A central limit order book exposes price levels and available size, allowing direct calculation of spread, depth, and slippage. Large positions can use negotiated blocks, while auctions gather scattered demand at one clearing time. tZERO describes all three models within its infrastructure.
A permissioned AMM (Automated Market Maker) can replace passive order-book waiting with pooled liquidity and formula-based pricing. But the pool must still contain enough eligible capital near the current price. |
A permissioned automated market maker uses pooled capital and contract-based pricing. In a basic constant-product pool:
x × y = k
Selling into the pool changes the reserve ratio, so the price deteriorates as order size grows.
Concentrated liquidity adds another layer. Providers choose price ranges instead of supporting the whole curve. Capital outside the active range cannot fill the next trade, so total pool value may overstate usable depth near the market price. Uniswap’s technical documentation describes this range-based model.
A hotel interest with infrequent valuations and a narrow investor base may fit blocks or scheduled auctions. A standardized token with regular NAV updates and committed pool capital may support a permissioned AMM for smaller trades. Hybrid markets can route larger positions to blocks.
The architecture does not settle the liquidity question. The decisive evidence remains active buy-side capital at the investor’s intended exit size.
The Allocation Decision Rule
Before approving a tokenized property allocation, request the median and 95th-percentile spreads, depth within 2%, slippage at the expected sale size, zero-trade days, stressed exit time, free-float concentration, market-maker commitments, NAV frequency, historical discounts, lockups, redemption rights, and settlement rules.
The market can then be classified into four practical stages.
- Operationally transferable means an eligible buyer and seller can complete a legally valid transfer.
- Periodically tradable describes a market with occasional executions and long gaps between them.
- Moderately liquid requires recurring two-sided quotes, measurable depth, and several independent participants.
- Large-position executable means the planned holding can be unwound within a defined price impact and time limit.
For St. Regis Aspen, the public material verifies a tokenized investment structure, access to secondary-market infrastructure, and T+0 settlement capability. It does not provide enough historical quote and execution data to establish moderate or large-position liquidity.
That is a transparent limitation of the available evidence, not a conclusion about the property itself.
Within the wider real-world asset tokenization architecture, liquidity must be measured after issuance. Separate the minimum entry amount from the executable exit size, test the intended position, identify who supplies buy-side capital, and verify the legal path from execution to the authoritative ownership record.
Disclaimer: This article is educational and does not constitute investment, legal, or tax advice.
FAQs
Does tokenization guarantee real estate liquidity?
No. It can reduce the minimum investment and improve transfer administration. A practical exit still requires eligible buyers, committed capital, market depth, and a block, auction, AMM, or redemption route.
How do you calculate liquidity depth in tokenized real estate?
Add executable orders within 1% or 2% of the midpoint, then simulate the intended sale through each price level. Report dollar depth and depth as a percentage of investable free float.
What is a good bid-ask spread for a property token?
There is no universal threshold. Evaluate the spread together with quoted size, trading frequency, appraisal freshness, free float, market-maker support, and the planned exit amount.
Is an ATS more liquid than an AMM?
Neither is automatically more liquid. An ATS needs recurring orders and counterparties. An AMM needs sufficient capital in active price ranges, reliable reference pricing, and enforceable transfer controls.
Can tokenized real estate trade continuously?
The technical rail may operate continuously, but execution can still be limited by venue hours, cash funding, investor verification, transfer restrictions, and transfer-agent processing.