An institutional analyst can open three RWA reports and find three very different answers to the same question. One dashboard may show about $30 billion in transferable assets. Another may report close to $400 billion represented through blockchain systems. A consulting report may then project that spending could reach several trillion dollars by 2030.
The disagreement is usually not caused by bad arithmetic. Each source is measuring a different market.
Some figures measure assets that have already been issued and can move between eligible wallets. Others count assets recorded through blockchain infrastructure, transaction activity, or traditional securities that could be tokenized in the future.
So, how much value is active on-chain, how much is represented through blockchain infrastructure, and how much exists only inside a forecast?
The answer depends on what each source counts, when the data was measured, and whether repeated economic exposure has been removed.
These principles also connect to the wider legal and technical questions covered in our guide to RWA Tokenization Architecture and Empirical Analysis.
What Should Count as a Real-World Asset?
A real-world asset token represents an economic claim connected to an asset, cash flow, security, commodity, loan, fund, or property outside the blockchain.
A token name and contract address are not enough. The structure should identify the issuer, legal entity, underlying asset, custodian, rights, transfer rules, valuation process, redemption mechanism, and insolvency treatment.
Common RWA categories include
- Government securities (BlackRock's BUIDL, $BENJI & Circle's USYC),
- Money market funds ($USDM & $STBT),
- Corporate credit (Backed Finance & $CHEX),
- Private credit (Centrifuge, Maple Finance, & Goldfinch),
- Public equities (Ondo Global Markets & Dinari),
- Investment funds (Securitize),
- Commodities ($PAXG, $XAUT & AgriDex),
- Real estate (RealT, Lofty AI & Propy),
- And selected revenue rights (Brickken & Opulous).
However, stablecoins such as USDT and USDC, tokenized deposits, central bank digital currencies, repos, derivatives, and synthetic products should be measured separately because they serve different purposes.
Stablecoins act as settlement money, not as investment assets. Just as stock market value does not include cash held in bank accounts, an RWA market estimate should not combine transaction money with the underlying assets it is used to buy.
The market boundary must be declared before calculation. Otherwise, one estimate may describe transferable securities while another combines securities, settlement money, ledger records, and future markets.
The Four Methodologies Behind RWA Market Headlines
RWA headlines often mix up four different ways of measuring financial data. To understand the market clearly, these four methodologies must be evaluated on their own instead of being lumped together.
1. Current Outstanding Value
This approach isolates the actual net economic exposure active on a specific date. It uses a circulating token supply, fund Net Asset Value (NAV), or unpaid principal debt. This method gives an accurate snapshot of active capital because it subtracts redemptions, defaults, and token burns.
2. Represented Value
This method tracks assets recorded or reconciled through blockchain systems for back-office efficiency. This often includes assets on private bank networks that cannot move into external wallets. While a high represented balance proves that legacy institutions are adopting the infrastructure, it does not mean these assets represent open market liquidity.
3. Activity Measures
This methodology tracks transactional momentum over time by counting lifetime lending originations, trading turnover, or settlement volume.
The Volume Illusion
Activity metrics show infrastructure use rather than active capital pools. For example, a private credit protocol might claim $2 billion in lifetime originations, but if borrowers have paid back most of it, only $600 million remains in active unpaid principal. Trading volume shows velocity, not unique outstanding wealth.
4. Forecast Value
This forward-looking approach estimates how much traditional market supply will move on-chain over the next decade. Analysts calculate this by taking a traditional Total Addressable Market (TAM) and applying an assumed adoption percentage to that pool.
What RWA.xyz, McKinsey, Citi, and BCG Actually Measure
Each figure becomes easier to interpret when matched with its research question.
Source | Headline figure | Measurement | Main boundary |
$30.87B distributed and $398.59B represented | Live tracked value | Stablecoins reported separately | |
McKinsey | About $2T by 2030, with a $1T to $4T range | Selected financial assets | Cryptocurrencies and stablecoins excluded |
Citi | $5.5T base case by 2030, with $2.7T bear and $8.2T bull cases | Scenario forecast | Stablecoins are modeled separately; adoption is concentrated in selected public and private assets |
BCG | $14T by 2030 and $55T by 2035 | Broad asset-class projection | Coverage and exclusions depend on the stated asset-class perimeter |
RWA.xyz measures assets already issued or represented through blockchain systems. On June 29, 2026, its dashboard reported $30.87 billion in distributed assets, $398.59 billion in represented assets, and $298.50 billion in stablecoins.
Distributed assets can move outside the issuing platform and transfer between eligible wallets. Represented assets remain inside the issuing environment and use blockchain mainly for recordkeeping, servicing, or reconciliation.
A large represented balance indicates blockchain use without proving open transferability or liquid trading.
McKinsey estimates that tokenized market capitalization could reach about $2 trillion by 2030, with lower and upper cases of roughly $1 trillion and $4 trillion. It excludes cryptocurrencies and stablecoins to avoid counting settlement cash as an asset.
Citi’s 2026 forecast starts from an estimated $17 billion market and projects $5.5 trillion in its 2030 base case. Its bear case is $2.7 trillion, while its bull case reaches $8.2 trillion. Citi expects public equities and Treasuries to lead adoption and models regulated stablecoins separately.
BCG presents the broadest long-range estimate. Its middle scenario reaches $14 trillion by 2030 and $55 trillion by 2035. BCG also notes that tokenized RWAs, excluding stablecoins and repos, remained below $25 billion in April 2026. It highlights the gap between issuances and long-term assumptions.
How Trillion-Dollar RWA Forecasts Are Built
A defensible forecast starts with eligible asset classes, not a headline.
The baseline mathematical approach relies on a standard penetration matrix applied to a specific global financial pool:
Projected tokenized value = projected asset base × assumed tokenization penetration
Suppose an eligible market reaches $50 trillion by 2030 with 10% tokenization. The forecast is $5 trillion, even when current issuance remains small.
However, linear adoption curves fail to reflect regulatory and structural realities. An institutional model must separate the market into distinct velocity layers. This matters because asset complexity dictates very different scaling timelines:
- High-Velocity Vector (Government Securities & MMFs): Characterized by standardized underlying assets, frequent daily pricing, mature custody frameworks, and programmatic redemption loops. These scale rapidly via programmatic public and private rails.
- Low-Velocity Vector (Private Credit, Real Estate, & Private Equity): Constrained by infrequent independent valuations, non-standardized legal rights, heavily restricted investor eligibility, and structurally thin secondary market liquidity. These scale slowly through bespoke institutional frameworks.
Moreover, a model should disclose its base year, asset pools, adoption rates, geographic scope, exclusions, stablecoin treatment, and scenario range. Required annual growth can be calculated using:
CAGR (Compound Annual Growth Rate) = (ending value ÷ beginning value)^(1 ÷ number of years) - 1
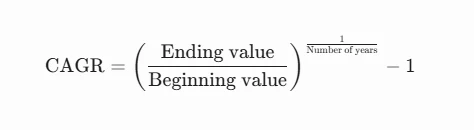
The calculated CAGR shows the mathematical growth path connecting the starting value with the forecast value. It does not prove that regulation, custody, distribution, interoperability, or market demand will develop at the required pace.
A credible forecast should present conservative, base, and accelerated scenarios. Each should disclose asset assumptions, starting values, adoption rates, exclusions, geography, and treatment of tokenized money.
Where RWA Market Estimates Double Count Value
Double counting begins when one economic claim appears several times.
Consider a Treasury fund issued across multiple networks. If the same master fund shares are mirrored, locked, burned, or reissued across chains, adding every network balance without reconciliation can repeat the same exposure.
Protocol TVL creates another overlap. A Treasury token is already included in the outstanding RWA value before it enters a lending pool. Adding the fund value and the lending protocol’s TVL counts one asset twice.
Total Value Locked (TVL) is an important measure in the cryptocurrency space. It shows the total value, in U.S. dollars, of all the assets that people have locked or staked in a blockchain or decentralized application (dApp). TVL can indicate how much value is deposited in a protocol, but it can also be inflated by incentives, leverage, wrappers, or reused collateral |
Fund wrappers can produce the same error. If a dataset counts a tokenized fund and then separately counts every tokenized security held by that fund, the calculation includes both the wrapper and its contents.
Stablecoin reserves also require look-through analysis. A stablecoin backed by Treasury instruments should not be added to those same reserve assets as though they were unrelated holdings.
Cumulative activity creates another error. Originations, trading volume, and settlement value may reuse the same capital. Current size should use outstanding principal, NAV, or circulating exposure after redemptions, defaults, burns, and write-offs.
To reduce inflated estimates and isolate authentic, non-rehypothecated value on-chain, researchers must apply a strict deduplication framework to clean the dataset:
The Double-Counting Trap
Double counting occurs the moment a single economic claim is recorded across multiple ledger layers. Directly aggregating a protocol's downstream Total Value Locked (TVL) with an issuer's primary asset supply introduces structural data inflation.
A practical formula is:
Net verifiable RWA value = gross eligible outstanding value - duplicated cross-chain supply - wrapper overlap - reserve overlap - redeemed or inactive supply
Gross eligible outstanding value is the total value of active RWA instruments that meet the stated verification and inclusion criteria. Duplicated cross-chain supply is the same underlying asset value counted more than once across multiple blockchains. Wrapper overlap is a value double-counted through both an original token and a fund, vault, or wrapper that holds it. Reserve overlap is the value counted both in a tokenized product and in the underlying assets backing that product. Redeemed or inactive supply is token supply that remains visible on-chain but no longer represents an active economic claim. |
What On-Chain Data Can and Cannot Verify
Blockchain data can confirm contract addresses, token supply, mint and burn activity, transfers, wallet balances, holder concentration, and certain permission controls. These records show whether supply changed and tokens moved between eligible holders.
However, the blockchain cannot independently prove that a custodian holds the underlying asset, that the reported NAV is correct, that the legal claim is enforceable, or that the structure protects claimholders during bankruptcy.
Franklin Templeton illustrates the need for off-chain reconciliation. Its official page reported $813.50 million in total net assets for the Franklin OnChain U.S. Government Money Fund as of May 31, 2026. A researcher comparing BENJI entries must determine whether they represent one fund, separate share classes, wrappers, or distinct products before adding their values.
Infrastructure capacity must also remain separate from the issued value. DTCC reported that DTC custodies more than $114 trillion in assets while planning limited tokenized production trades for July 2026 and a wider service launch in October. The custody figure describes DTC’s broader operational base, not the value issued through its tokenization service.
The strongest evidence starts with audited or regulated reports, followed by issuer and administrator records, custodian evidence, verified contracts, and reputable dashboards.
A Three-Level Framework for Verifying RWA Values
Not every RWA market figure offers the same level of transparency. Analysts can classify reported values according to how independently the underlying data can be verified.
Level 1: Fully Observable On-Chain
Token supply, wallet balances, minting, burning, and transfers can be reconstructed directly from blockchain records. This provides strong evidence of circulating supply, although legal ownership, custody, and collateral still require off-chain confirmation.
Level 2: On-Chain Supply With External Valuation
Token supply is visible on-chain, but its dollar value depends on an external NAV, price feed, oracle, exchange quote, or issuer report. Analysts must verify both the circulating supply and the timing, reliability, and methodology of the valuation source.
Level 3: Institutionally Represented Value
Blockchain records support ownership, settlement, servicing, or reconciliation, while the reported value depends mainly on the issuer, administrator, custodian, or platform. These assets may be economically significant but provide less independent visibility than publicly observable tokens.
This framework prevents distributed, externally priced, and institutionally represented assets from being treated as equally verifiable. Market estimates should disclose how much reported value belongs to each level before combining the figures into one total.
A Seven-Step Method for Testing an RWA Market Estimate
Researchers can test an RWA estimate through seven methodological checks:
- Define the research question and valuation date.
- List the included asset classes and legal claim types.
- Separate distributed assets from represented records.
- State whether stablecoins, deposits, repos, derivatives, and synthetic assets are included.
- Use outstanding economic exposure instead of cumulative transaction activity.
- Remove cross-chain, wrapper, collateral, reserve, and inactive-supply duplication.
- Reconcile blockchain supply with issuer, administrator, custodian, valuation, and redemption records.
Market activity and liquidity should be reported as separate analytical categories. Holder concentration, transfer volume, bid depth, redemption speed, spreads, and collateral use describe market activity or market quality. They do not increase the amount of unique economic exposure outstanding.
Conclusion
The RWA market does not have one universal size because available estimates measure different objects. Some track distributed token balances, others include represented institutional records, and others model future adoption across traditional asset classes.
As of a stated measurement date, live distributed assets may remain in the tens of billions of dollars, while represented values are substantially larger. Trillion-dollar projections from McKinsey, Citi, and BCG describe possible future market penetration rather than assets already issued, transferable, or independently verified on-chain.
A technically credible estimate must define its market perimeter, use a consistent valuation unit, separate outstanding value from transaction activity, remove repeated exposure, document its valuation date, and reconcile blockchain data with issuer, administrator, custodian, and legal records.
The most reliable RWA estimate is therefore not the largest figure. It is the estimate whose definitions, inputs, exclusions, assumptions, and reconciliation methods can be reproduced and tested.
Disclaimer: This article is for informational and research purposes only and does not constitute financial, legal, tax, or investment advice. RWA market figures, forecasts, and product data may change over time, so readers should verify all information using current primary sources before relying on it.