
A private company can reach a billion-dollar valuation and still produce very different outcomes for founders, employees, and investors. The reason is often hidden in the capitalization table and the rights attached to each share class.
Before investing in a growth-stage company, experienced investors do not only ask, “What is this company worth?” They ask more important questions:
Who owns the company after multiple rounds of financing?
Which shareholders receive priority during an exit?
How much ownership could disappear after future funding?
Will employee equity programs reduce investor returns?
A company’s valuation represents the market’s estimate of its worth, but it does not explain how that value will be distributed among shareholders.
A cap table analysis framework helps investors evaluate ownership structure, shareholder rights, dilution exposure, and exit outcomes before committing capital. This becomes increasingly important as companies remain private longer and complete larger funding rounds before reaching public markets.
According to PitchBook-NVCA Venture Monitor data, venture-backed companies have increasingly relied on private financing before IPOs, making ownership modeling and private-market due diligence more important than ever.
As private companies add multiple investor classes, convertible securities, and employee equity programs, understanding the cap table becomes essential for evaluating the real economics of an investment.
What Cap Table Analysis Reveals Beyond Company Valuation
A capitalization table, commonly known as a cap table, is a detailed record of company ownership and the rights attached to each security.
At an early stage, ownership may appear simple:
- Founders hold common shares
- Employees receive stock options
- Early investors receive preferred shares
However, after several financing rounds, the structure becomes significantly more complex.
A late-stage private company may include:
- Founder common stock
- Series A, B, and C preferred stock
- Convertible preferred shares
- Employee option pools
- Warrants
- Convertible notes
- Investor protection agreements
The purpose of cap table analysis is not only to calculate ownership percentages. It is to understand how ownership behaves under different scenarios, such as:
- New financing rounds
- Down rounds
- Acquisitions
- IPO conversions
- Secondary transactions
For example, two investors may each own 10% of a company, but one investor may hold preferred shares with liquidation preference rights while another owns common shares. During an exit, these two investors may receive very different payouts.
Therefore, professional investors analyze both ownership and economic rights.
The Core Components of a Pre-IPO Cap Table Framework
Fully Diluted Ownership Determines Real Equity Exposure
One of the most common mistakes in private-market investing is reviewing only currently issued shares.
A professional cap table analysis uses fully diluted ownership, which includes potential future ownership claims.
The calculation is:
Fully Diluted Shares = Issued Shares + Employee Options + Warrants + Convertible Securities
Fully diluted capitalization generally includes outstanding common shares and preferred shares on an as-converted basis. Also, granted and ungranted options, warrants, and shares issuable upon conversion of SAFEs, notes, or other convertible instruments
This method provides a realistic ownership picture because companies often reserve equity for:
- Future employees
- Executives
- Strategic investors
- Convertible instruments
For example, a founder may appear to own 60% of issued shares. However, after including a 15% employee option pool and convertible securities, the founder’s actual economic ownership may be much lower.
Investors use fully diluted ownership to estimate:
- True ownership percentage
- Future dilution risk
- Expected return scenarios
- Financing impact
Primary and Secondary Transactions Change Ownership Differently
Private companies typically experience ownership changes through two major transaction types.
Primary Financing
A primary transaction occurs when a company issues new shares to investors.
Example:
A company raises a $50 million Series C round.
The company receives new capital, but existing shareholders experience dilution because new shares are created.
Secondary Transaction
A secondary transaction occurs when existing shareholders sell shares to another buyer.
The company does not receive new capital. Instead, the selling shareholder receives liquidity.
Secondary transactions are commonly used by:
- Employees seeking liquidity
- Early venture investors
- Founders reducing personal exposure
Private-market secondary activity has expanded as companies stay private longer. Reports from firms such as Jefferies and other secondary-market researchers have shown increasing demand for private-share liquidity among investors and employees.
However, secondary buyers must review:
- Transfer restrictions
- Company approval requirements
- Share class rights
- Investor protections
This is why cap table analysis connects directly with pre-IPO valuation models, deal structures, and private-market pricing analysis.
How Liquidation Preferences Change Investor Exit Returns
A company’s valuation does not determine shareholder returns by itself. The final outcome depends heavily on shareholder rights.
A liquidation preference determines who receives proceeds first during a liquidity event, including:
- Acquisition
- Merger
- IPO-related transaction
- Private secondary exit
Preferred investors commonly receive priority over common shareholders.
The most common structure is a 1x non-participating liquidation preference.
Under this structure, the investor chooses between:
- Receiving the original investment amount before other shareholders receive proceeds
- Converting preferred shares into common shares and participating according to ownership percentage
The investor chooses whichever option provides the higher return.
Worked Example: How Liquidation Preference and Full-Ratchet Anti-Dilution Change Investor Outcomes
Consider a private company with this ownership structure:
Shareholder | Ownership | Security Type |
Founder | 55% | Common Shares |
Series A Investor | 20% | Preferred Shares |
Series B Investor | 15% | Preferred Shares |
Employee Option Pool | 10% | Equity Incentives |
The Series B investor invests:
$20 million
Terms:
- 1x non-participating liquidation preference
- Full-ratchet anti-dilution protection
Later, the company experiences a down round.
Original Series B share price:
$10 per share
New financing price:
$5 per share
Scenario 1: No Investor Protection
If shareholders only receive proceeds based on ownership during a $100 million acquisition:
Shareholder | Ownership Payout |
Founder | $55 million |
Series A Investor | $20 million |
Series B Investor | $15 million |
Employees | $10 million |
The Series B investor receives only $15 million despite investing $20 million.
Scenario 2: 1x Non-Participating Liquidation Preference
Because the Series B investor has a 1x preference, they receive:
$20 million first
The remaining exit value becomes:
$100 million - $20 million = $80 million
The remaining shareholders then divide the remaining proceeds according to their rights.
This protects the investor during lower-value exits.
Scenario 3: Full-Ratchet Anti-Dilution Adjustment
Before the down round:
1 preferred share = 1 common share
After the down round:
Original price ÷ New price
$10 ÷ $5 = 2
The investor’s conversion ratio becomes:
2 preferred shares for every common share equivalent
The result:
Stakeholder | Impact |
Early investor | Receives stronger downside protection |
Founder | Experiences additional dilution |
Employees | Option pool value decreases |
Later investors | Face greater ownership competition |
This is why sophisticated investors model liquidation preference and anti-dilution together rather than reviewing each term separately.
How Investors Model Liquidation Waterfalls
As companies complete additional funding rounds, liquidation preferences may stack.
A typical waterfall may look like:
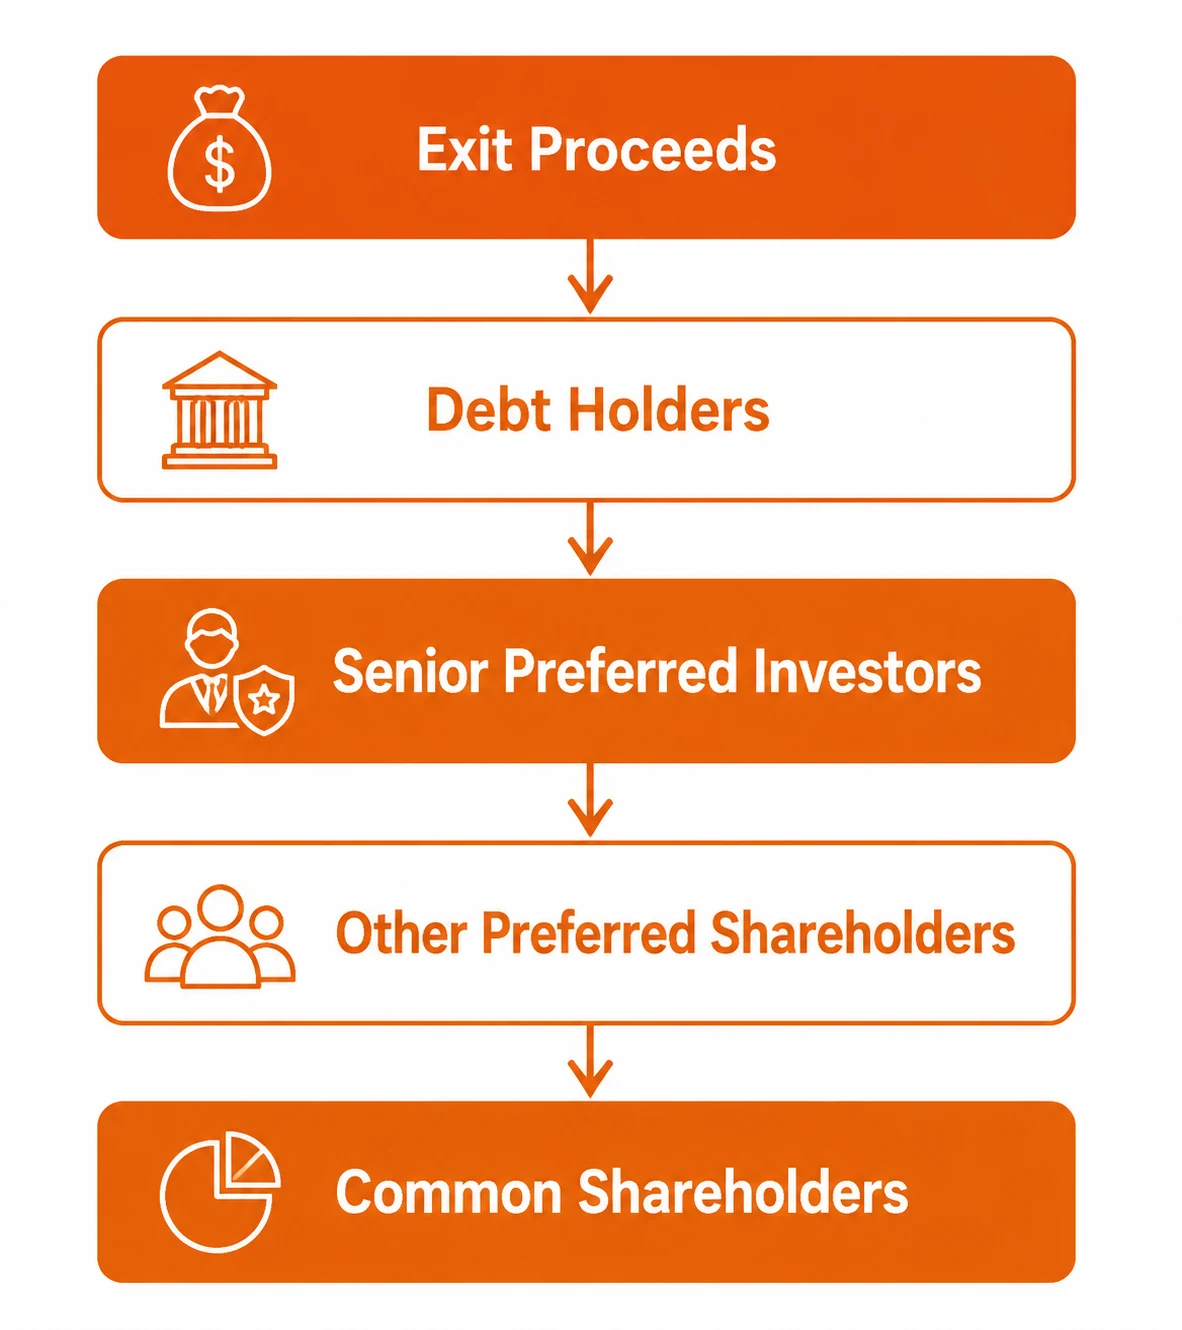
Investors analyze whether terms include:
- Participating preferences
- Preference caps
- Pari passu rights
- Seniority rights
Participating preferred shares can create greater investor protection because investors receive their preference amount and then participate again in remaining proceeds.
For this reason, investors should model multiple outcomes:
- Low-value acquisition
- Moderate exit
- High-growth IPO scenario
Anti-Dilution Protection Investors Must Evaluate
A company’s valuation does not always increase during every financing round. When companies raise capital at a lower valuation than previous rounds, the event is called a down round.
Anti-dilution provisions protect certain investors from losing economic value.
The two main structures are:
- Full-ratchet anti-dilution
- Weighted-average anti-dilution
Full-Ratchet Anti-Dilution
Full-ratchet protection provides the strongest investor protection.
It completely adjusts the investor conversion price to the new lower financing price.
Advantages:
- Protects early investors
- Reduces downside exposure
Risks:
- Increases founder dilution
- Reduces employee ownership
- Makes future financing more difficult
Weighted-Average Anti-Dilution
Weighted-average protection considers:
- Existing shares outstanding
- Number of new shares issued
- New financing price
Unlike a full ratchet, it does not completely reset the conversion price.
Protection Type | Dilution Impact |
Full Ratchet | Highest |
Weighted Average | Moderate |
Broad-based weighted-average protection is commonly used because it balances investor protection with company flexibility.
Option Pool Sizing and Its Impact on Ownership Dilution
Employee option pools allow companies to attract and retain employees through equity compensation.
However, option pool size directly affects ownership.
Investors often negotiate option pools before financing because future hiring requirements influence ownership economics.
Example:
Before financing:
Holder | Ownership |
Founder | 70% |
Investor | 20% |
Existing Option Pool | 10% |
The investor requires an additional 10% option pool.
If created before financing, founders usually absorb more dilution.
If created after financing, dilution may be distributed differently.
Therefore, investors evaluate:
- Current option pool size
- Future hiring requirements
- Pool timing
- Founder ownership impact
Carta equity research shows that employee equity allocation remains a significant component of venture-backed company compensation structures, especially for technology companies competing for specialized talent.
How Investors Perform Cap Table Due Diligence
A professional cap table review follows a structured process.
Step 1: Review Ownership History
Investors analyze:
- Previous financing rounds
- Founder dilution
- Convertible securities
- Employee grants
This reveals how ownership changed over time.
A professional cap table review follows a structured process. Investors first verify ownership data, then model shareholder rights, dilution effects, and possible exit outcomes before making an investment decision.
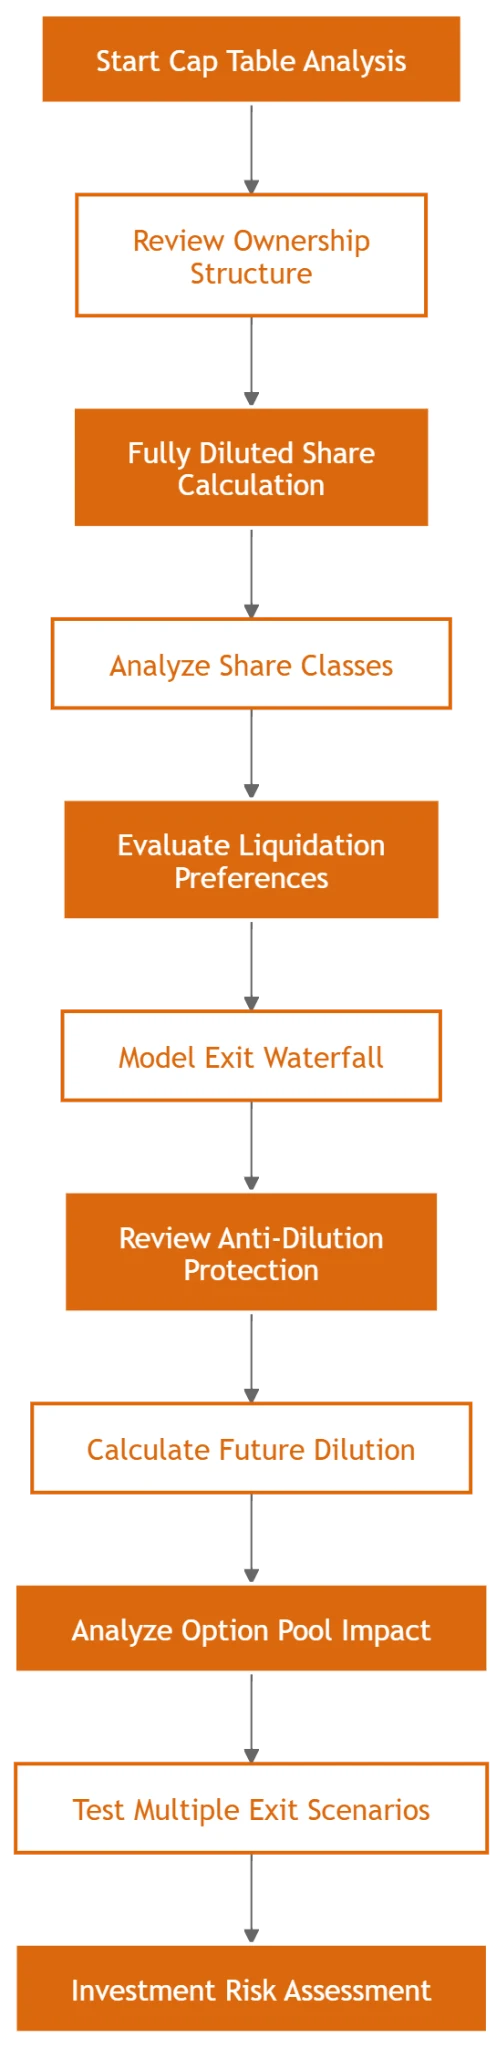
This diagram visually explains the workflow:
Ownership → Share Rights → Waterfall → Dilution → Exit Risk
Step 2: Analyze Shareholder Rights
Investors review:
- Liquidation preferences
- Anti-dilution provisions
- Conversion rights
- Voting rights
- Pro-rata rights
These term are commonly documented through financing frameworks such as NVCA model legal documents.
Step 3: Validate Cap Table Accuracy
Common issues include:
- Missing option grants
- Incorrect share counts
- Unconverted notes
- Undisclosed investor rights
- Outdated ownership records
A reliable cap table should match:
- Legal agreements
- Financing documents
- Board approvals
- Equity records
How Investors Build a Cap Table Sensitivity Model Before Investing
A cap table does not show only the current ownership structure. Professional investors use it to test how different business outcomes may affect shareholder returns.
Before committing capital, investors typically build sensitivity models that evaluate multiple exit scenarios, because the same ownership structure can produce very different results depending on valuation, financing terms, and shareholder rights.
A typical sensitivity model tests:
- Downside acquisition scenario
- Base-case exit scenario
- High-growth IPO scenario
- Additional funding dilution
- Conversion decisions between preferred and common shares

This approach helps investors understand whether the company’s valuation is supported by realistic shareholder economics.
Example of Cap Table Sensitivity Analysis
Assume:
- Company exit value: $100 million
- Series B investment: $20 million
- Liquidation preference: 1x non-participating
- Investor ownership: 15%
Scenario | Exit Value | Preferred Investor Outcome | Common Shareholder Impact |
Downside Exit | $50M | Preference may provide capital recovery priority | Lower founder return |
Base Exit | $100M | Investor compares preference vs conversion value | Moderate shareholder return |
Growth Exit | $500M | Conversion usually becomes more valuable | Higher common shareholder upside |
The purpose of this model is not to predict the exact future valuation. Instead, it shows how shareholder rights influence the distribution of value under different outcomes.
Why Sensitivity Modeling Matters in Pre-IPO Investing
A company may appear attractive based on valuation growth alone, but investors need to understand whether that growth translates into actual shareholder returns.
For example:
- A company with multiple stacked liquidation preferences may create strong investor protection but reduce common shareholder upside.
- A large option pool expansion may support hiring but increase founder dilution.
- Strong anti-dilution rights may protect early investors but create challenges during future fundraising.
Therefore, investors evaluate not only:
"How much is the company worth?"
but also:
"How much value does each shareholder actually capture under different outcomes?"
Cap Table Red Flags Investors Should Identify
Red Flag | Why It Matters |
Multiple stacked preferences | Can reduce common shareholder returns |
Large option pool expansion | Creates additional dilution |
Full-ratchet protection | Creates significant founder dilution risk |
Unclear convertible securities | Creates ownership uncertainty |
Weak transfer documentation | Creates liquidity problems |
Final Cap Table Framework Before Investing
Before entering a pre-IPO investment, investors should:
✓ Calculate fully diluted ownership
✓ Review all preferred share rights
✓ Model liquidation waterfalls
✓ Test anti-dilution outcomes
✓ Analyze option pool dilution
✓ Review transfer restrictions
✓ Compare multiple exit scenarios
Cap table analysis transforms complex ownership structures into measurable investment risks. A company’s valuation may attract attention, but shareholder rights and financing terms determine who ultimately captures the value created.
Disclaimer:
FAQs
What Is A Cap Table Analysis Framework?
A cap table analysis framework evaluates ownership structure, shareholder rights, dilution exposure, and exit outcomes. Investors use it to understand how financing terms affect potential returns before investing in private companies.
How Does Liquidation Preference Affect Investor Returns?
Liquidation preference determines who receives proceeds first during an exit. A 1x preference allows preferred investors to recover their investment before common shareholders receive the remaining proceeds.
What Is Full-Ratchet Anti-Dilution Protection?
Full-ratchet anti-dilution protection adjusts an investor’s conversion price after a lower-priced financing round. It protects early investors but increases dilution for founders and employees.
Why Does Option Pool Size Matter?
Option pool size affects ownership because additional employee equity reduces existing shareholder percentages. Investors analyze pool timing because it changes founder and investor dilution.
What Should Investors Review Before Buying Pre-IPO Shares?
Investors should review ownership structure, liquidation preferences, anti-dilution terms, option pools, transfer restrictions, shareholder rights, and exit scenarios before investing.